Immigrants from Indonesia vs Iranian In Labor Force | Age > 16

COMPARE

Immigrants from Indonesia
Race
Ancestry
AfghanAfricanAlaska NativeAlaskan AthabascanAlbanianAleutAlsatianAmericanApacheArabArapahoArgentineanArmenianAssyrian/Chaldean/SyriacAustralianAustrianBahamianBangladeshiBarbadianBasqueBelgianBelizeanBermudanBhutaneseBlackfeetBolivianBrazilianBritishBritish West IndianBulgarianBurmeseCajunCambodianCanadianCape VerdeanCarpatho RusynCelticCentral AmericanCentral American IndianCherokeeCheyenneChickasawChileanChineseChippewaChoctawColombianColvilleComancheCosta RicanCreeCreekCroatianCrowCubanCypriotCzechCzechoslovakianDanishDelawareDominicanDutchDutch West IndianEastern EuropeanEcuadorianEgyptianEnglishEstonianEthiopianEuropeanFijianFilipinoFinnishFrenchFrench American IndianFrench CanadianGermanGerman RussianGhanaianGreekGuamanian/ChamorroGuatemalanGuyaneseHaitianHmongHonduranHopiHoumaHungarianIcelanderIndian (Asian)IndonesianInupiatIraqiIrishIroquoisIsraeliItalianJamaicanJapaneseJordanianKenyanKiowaKoreanLaotianLatvianLebaneseLiberianLithuanianLumbeeLuxembourgerMacedonianMalaysianMalteseMarshalleseMenomineeMexicanMexican American IndianMongolianMoroccanNative HawaiianNavajoNepaleseNew ZealanderNicaraguanNigerianNorthern EuropeanNorwegianOkinawanOsageOttawaPaiutePakistaniPalestinianPanamanianParaguayanPennsylvania GermanPeruvianPimaPolishPortuguesePotawatomiPuebloPuerto RicanPuget Sound SalishRomanianRussianSalvadoranSamoanScandinavianScotch-IrishScottishSeminoleSenegaleseSerbianShoshoneSierra LeoneanSiouxSlavicSlovakSloveneSomaliSouth AfricanSouth AmericanSouth American IndianSoviet UnionSpaniardSpanishSpanish AmericanSpanish American IndianSri LankanSubsaharan AfricanSudaneseSwedishSwissSyrianTaiwaneseThaiTlingit-HaidaTohono O'OdhamTonganTrinidadian and TobagonianTsimshianTurkishU.S. Virgin IslanderUgandanUkrainianUruguayanUteVenezuelanVietnameseWelshWest IndianYakamaYaquiYugoslavianYumanYup'ikZimbabwean
Immigration
NonimmigrantsImmigrantsAfghanistanAfricaAlbaniaArgentinaArmeniaAsiaAustraliaAustriaBahamasBangladeshBarbadosBelarusBelgiumBelizeBoliviaBosnia and HerzegovinaBrazilBulgariaBurma/MyanmarCabo VerdeCambodiaCameroonCanadaCaribbeanCentral AmericaChileChinaColombiaCongoCosta RicaCroatiaCubaCzechoslovakiaDenmarkDominicaDominican RepublicEastern AfricaEastern AsiaEastern EuropeEcuadorEgyptEl SalvadorEnglandEritreaEthiopiaEuropeFijiFranceGermanyGhanaGreeceGrenadaGuatemalaGuyanaHaitiHondurasHong KongHungaryIndiaIndonesiaIranIraqIrelandIsraelItalyJamaicaJapanJordanKazakhstanKenyaKoreaKuwaitLaosLatin AmericaLatviaLebanonLiberiaLithuaniaMalaysiaMexicoMicronesiaMiddle AfricaMoldovaMoroccoNepalNetherlandsNicaraguaNigeriaNorth AmericaNorth MacedoniaNorthern AfricaNorthern EuropeNorwayOceaniaPakistanPanamaPeruPhilippinesPolandPortugalRomaniaRussiaSaudi ArabiaScotlandSenegalSerbiaSierra LeoneSingaporeSomaliaSouth AfricaSouth AmericaSouth Central AsiaSouth Eastern AsiaSouthern EuropeSpainSri LankaSt. Vincent and the GrenadinesSudanSwedenSwitzerlandSyriaTaiwanThailandTrinidad and TobagoTurkeyUgandaUkraineUruguayUzbekistanVenezuelaVietnamWest IndiesWestern AfricaWestern AsiaWestern EuropeYemenZaireZimbabweAzores
Iranian
Race
Ancestry
AfghanAfricanAlaska NativeAlaskan AthabascanAlbanianAleutAlsatianAmericanApacheArabArapahoArgentineanArmenianAssyrian/Chaldean/SyriacAustralianAustrianBahamianBangladeshiBarbadianBasqueBelgianBelizeanBermudanBhutaneseBlackfeetBolivianBrazilianBritishBritish West IndianBulgarianBurmeseCajunCambodianCanadianCape VerdeanCarpatho RusynCelticCentral AmericanCentral American IndianCherokeeCheyenneChickasawChileanChineseChippewaChoctawColombianColvilleComancheCosta RicanCreeCreekCroatianCrowCubanCypriotCzechCzechoslovakianDanishDelawareDominicanDutchDutch West IndianEastern EuropeanEcuadorianEgyptianEnglishEstonianEthiopianEuropeanFijianFilipinoFinnishFrenchFrench American IndianFrench CanadianGermanGerman RussianGhanaianGreekGuamanian/ChamorroGuatemalanGuyaneseHaitianHmongHonduranHopiHoumaHungarianIcelanderIndian (Asian)IndonesianInupiatIranianIraqiIrishIroquoisIsraeliItalianJamaicanJapaneseJordanianKenyanKiowaKoreanLaotianLatvianLebaneseLiberianLithuanianLumbeeLuxembourgerMacedonianMalaysianMalteseMarshalleseMenomineeMexicanMexican American IndianMongolianMoroccanNative HawaiianNavajoNepaleseNew ZealanderNicaraguanNigerianNorthern EuropeanNorwegianOkinawanOsageOttawaPaiutePakistaniPalestinianPanamanianParaguayanPennsylvania GermanPeruvianPimaPolishPortuguesePotawatomiPuebloPuerto RicanPuget Sound SalishRomanianRussianSalvadoranSamoanScandinavianScotch-IrishScottishSeminoleSenegaleseSerbianShoshoneSierra LeoneanSiouxSlavicSlovakSloveneSomaliSouth AfricanSouth AmericanSouth American IndianSoviet UnionSpaniardSpanishSpanish AmericanSpanish American IndianSri LankanSubsaharan AfricanSudaneseSwedishSwissSyrianTaiwaneseThaiTlingit-HaidaTohono O'OdhamTonganTrinidadian and TobagonianTsimshianTurkishU.S. Virgin IslanderUgandanUkrainianUruguayanUteVenezuelanVietnameseWelshWest IndianYakamaYaquiYugoslavianYumanYup'ikZimbabwean
Immigration
NonimmigrantsImmigrantsAfghanistanAfricaAlbaniaArgentinaArmeniaAsiaAustraliaAustriaBahamasBangladeshBarbadosBelarusBelgiumBelizeBoliviaBosnia and HerzegovinaBrazilBulgariaBurma/MyanmarCabo VerdeCambodiaCameroonCanadaCaribbeanCentral AmericaChileChinaColombiaCongoCosta RicaCroatiaCubaCzechoslovakiaDenmarkDominicaDominican RepublicEastern AfricaEastern AsiaEastern EuropeEcuadorEgyptEl SalvadorEnglandEritreaEthiopiaEuropeFijiFranceGermanyGhanaGreeceGrenadaGuatemalaGuyanaHaitiHondurasHong KongHungaryIndiaIranIraqIrelandIsraelItalyJamaicaJapanJordanKazakhstanKenyaKoreaKuwaitLaosLatin AmericaLatviaLebanonLiberiaLithuaniaMalaysiaMexicoMicronesiaMiddle AfricaMoldovaMoroccoNepalNetherlandsNicaraguaNigeriaNorth AmericaNorth MacedoniaNorthern AfricaNorthern EuropeNorwayOceaniaPakistanPanamaPeruPhilippinesPolandPortugalRomaniaRussiaSaudi ArabiaScotlandSenegalSerbiaSierra LeoneSingaporeSomaliaSouth AfricaSouth AmericaSouth Central AsiaSouth Eastern AsiaSouthern EuropeSpainSri LankaSt. Vincent and the GrenadinesSudanSwedenSwitzerlandSyriaTaiwanThailandTrinidad and TobagoTurkeyUgandaUkraineUruguayUzbekistanVenezuelaVietnamWest IndiesWestern AfricaWestern AsiaWestern EuropeYemenZaireZimbabweAzores
In Labor Force | Age > 16
Income
Poverty
Unemployment
Labor Participation
Family Structure
Vehicle Availability
Education Level
Disability

In Labor Force | Age > 16 Comparison

Immigrants from Indonesia

Iranians

Exceptional
Exceptional
65.7%
IN LABOR FORCE | AGE > 16
96.8/ 100
METRIC RATING
115th/ 347
METRIC RANK
66.0%
IN LABOR FORCE | AGE > 16
99.2/ 100
METRIC RATING
91st/ 347
METRIC RANK

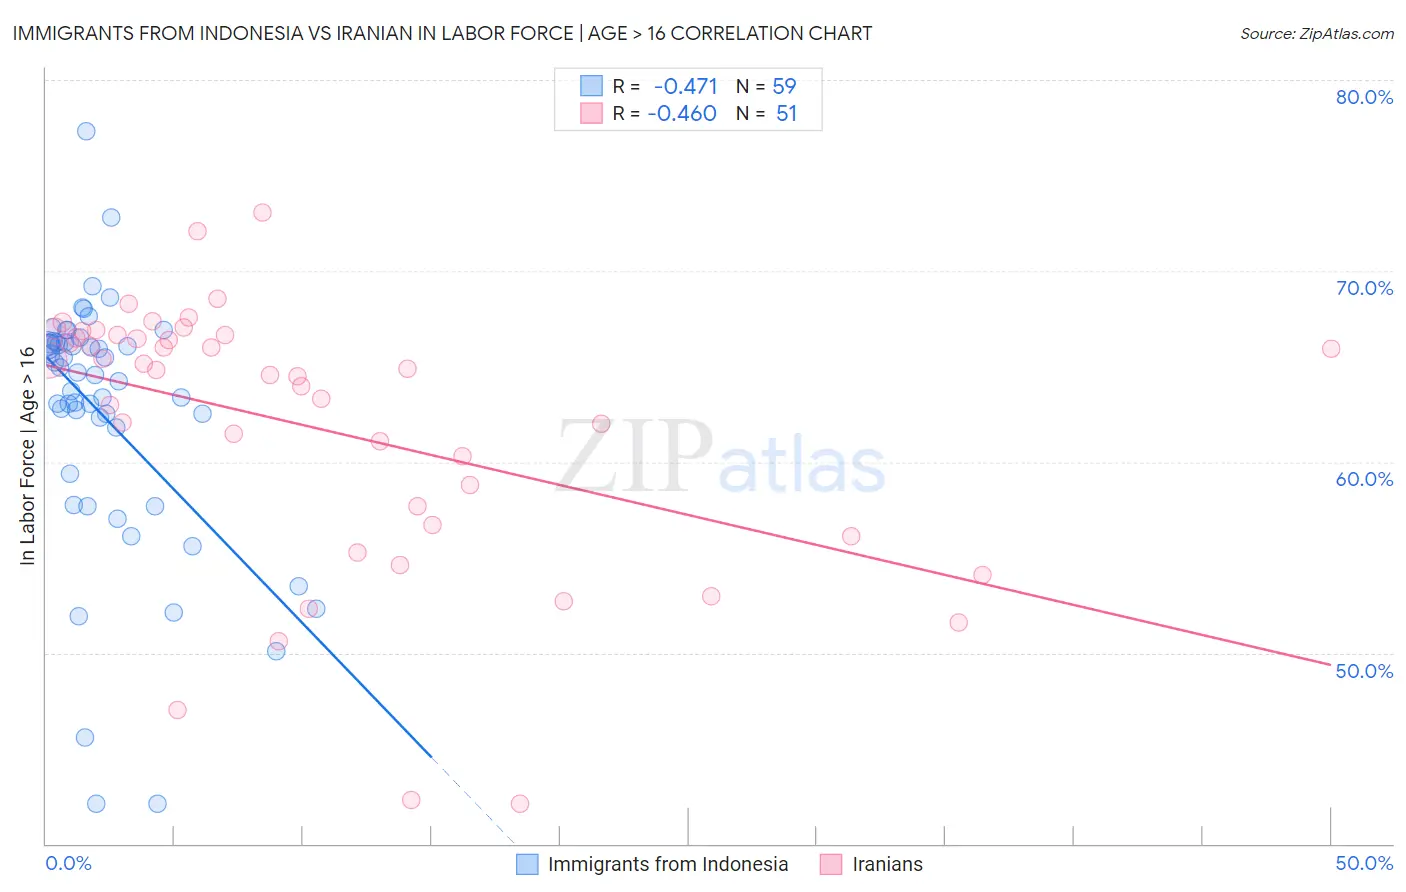
Immigrants from Indonesia vs Iranian In Labor Force | Age > 16 Correlation Chart

The statistical analysis conducted on geographies consisting of 215,789,599 people shows a moderate negative correlation between the proportion of Immigrants from Indonesia and labor force participation rate among population ages 16 and over in the United States with a correlation coefficient (R) of -0.471 and weighted average of 65.7%. Similarly, the statistical analysis conducted on geographies consisting of 316,907,854 people shows a moderate negative correlation between the proportion of Iranians and labor force participation rate among population ages 16 and over in the United States with a correlation coefficient (R) of -0.460 and weighted average of 66.0%, a difference of 0.40%.
Immigrants from Indonesia vs Iranian In Labor Force | Age > 16

In Labor Force | Age > 16 Correlation Summary

MeasurementImmigrants from IndonesiaIranian
Minimum42.1%42.1%
Maximum77.3%73.0%
Range35.2%30.9%
Mean62.4%61.8%
Median64.5%64.8%
Interquartile 25% (IQ1)59.4%56.7%
Interquartile 75% (IQ3)66.2%66.7%
Interquartile Range (IQR)6.8%10.0%
Standard Deviation (Sample)6.8%7.1%
Standard Deviation (Population)6.7%7.0%

Similar Demographics by In Labor Force | Age > 16

Demographics Similar to Immigrants from Indonesia by In Labor Force | Age > 16

In terms of in labor force | age > 16, the demographic groups most similar to Immigrants from Indonesia are Argentinean (65.7%, a difference of 0.010%), Immigrants from Iran (65.7%, a difference of 0.010%), Immigrants from Thailand (65.7%, a difference of 0.020%), Pakistani (65.8%, a difference of 0.030%), and Honduran (65.8%, a difference of 0.030%).
DemographicsRating | RankIn Labor Force | Age > 16
Immigrants | Spain
98.0
/100
|
#108
Exceptional
65.8%
Immigrants | Japan
98.0
/100
|
#109
Exceptional
65.8%
Japanese
97.7
/100
|
#110
Exceptional
65.8%
Immigrants | Honduras
97.5
/100
|
#111
Exceptional
65.8%
Laotians
97.4
/100
|
#112
Exceptional
65.8%
Pakistanis
97.1
/100
|
#113
Exceptional
65.8%
Hondurans
97.1
/100
|
#114
Exceptional
65.8%
Immigrants | Indonesia
96.8
/100
|
#115
Exceptional
65.7%
Argentineans
96.7
/100
|
#116
Exceptional
65.7%
Immigrants | Iran
96.6
/100
|
#117
Exceptional
65.7%
Immigrants | Thailand
96.6
/100
|
#118
Exceptional
65.7%
Immigrants | France
96.4
/100
|
#119
Exceptional
65.7%
Immigrants | Hong Kong
96.2
/100
|
#120
Exceptional
65.7%
New Zealanders
96.0
/100
|
#121
Exceptional
65.7%
Immigrants | Ecuador
95.9
/100
|
#122
Exceptional
65.7%

Demographics Similar to Iranians by In Labor Force | Age > 16

In terms of in labor force | age > 16, the demographic groups most similar to Iranians are Immigrants from Laos (66.0%, a difference of 0.010%), Chilean (66.0%, a difference of 0.010%), Aleut (66.0%, a difference of 0.020%), Immigrants from South America (66.0%, a difference of 0.030%), and Immigrants from Cambodia (66.0%, a difference of 0.040%).
DemographicsRating | RankIn Labor Force | Age > 16
Central Americans
99.4
/100
|
#84
Exceptional
66.1%
Mongolians
99.4
/100
|
#85
Exceptional
66.1%
South Americans
99.4
/100
|
#86
Exceptional
66.0%
South American Indians
99.4
/100
|
#87
Exceptional
66.0%
Bermudans
99.3
/100
|
#88
Exceptional
66.0%
Immigrants | Laos
99.2
/100
|
#89
Exceptional
66.0%
Chileans
99.2
/100
|
#90
Exceptional
66.0%
Iranians
99.2
/100
|
#91
Exceptional
66.0%
Aleuts
99.1
/100
|
#92
Exceptional
66.0%
Immigrants | South America
99.1
/100
|
#93
Exceptional
66.0%
Immigrants | Cambodia
99.1
/100
|
#94
Exceptional
66.0%
Immigrants | Uruguay
99.1
/100
|
#95
Exceptional
66.0%
Bangladeshis
98.9
/100
|
#96
Exceptional
65.9%
Filipinos
98.9
/100
|
#97
Exceptional
65.9%
Immigrants | Chile
98.7
/100
|
#98
Exceptional
65.9%