Immigrants from India vs Finnish In Labor Force | Age 45-54

COMPARE

Immigrants from India
Race
Ancestry
AfghanAfricanAlaska NativeAlaskan AthabascanAlbanianAleutAlsatianAmericanApacheArabArapahoArgentineanArmenianAssyrian/Chaldean/SyriacAustralianAustrianBahamianBangladeshiBarbadianBasqueBelgianBelizeanBermudanBhutaneseBlackfeetBolivianBrazilianBritishBritish West IndianBulgarianBurmeseCajunCambodianCanadianCape VerdeanCarpatho RusynCelticCentral AmericanCentral American IndianCherokeeCheyenneChickasawChileanChineseChippewaChoctawColombianColvilleComancheCosta RicanCreeCreekCroatianCrowCubanCypriotCzechCzechoslovakianDanishDelawareDominicanDutchDutch West IndianEastern EuropeanEcuadorianEgyptianEnglishEstonianEthiopianEuropeanFijianFilipinoFrenchFrench American IndianFrench CanadianGermanGerman RussianGhanaianGreekGuamanian/ChamorroGuatemalanGuyaneseHaitianHmongHonduranHopiHoumaHungarianIcelanderIndian (Asian)IndonesianInupiatIranianIraqiIrishIroquoisIsraeliItalianJamaicanJapaneseJordanianKenyanKiowaKoreanLaotianLatvianLebaneseLiberianLithuanianLumbeeLuxembourgerMacedonianMalaysianMalteseMarshalleseMenomineeMexicanMexican American IndianMongolianMoroccanNative HawaiianNavajoNepaleseNew ZealanderNicaraguanNigerianNorthern EuropeanNorwegianOkinawanOsageOttawaPaiutePakistaniPalestinianPanamanianParaguayanPennsylvania GermanPeruvianPimaPolishPortuguesePotawatomiPuebloPuerto RicanPuget Sound SalishRomanianRussianSalvadoranSamoanScandinavianScotch-IrishScottishSeminoleSenegaleseSerbianShoshoneSierra LeoneanSiouxSlavicSlovakSloveneSomaliSouth AfricanSouth AmericanSouth American IndianSoviet UnionSpaniardSpanishSpanish AmericanSpanish American IndianSri LankanSubsaharan AfricanSudaneseSwedishSwissSyrianTaiwaneseThaiTlingit-HaidaTohono O'OdhamTonganTrinidadian and TobagonianTsimshianTurkishU.S. Virgin IslanderUgandanUkrainianUruguayanUteVenezuelanVietnameseWelshWest IndianYakamaYaquiYugoslavianYumanYup'ikZimbabwean
Immigration
NonimmigrantsImmigrantsAfghanistanAfricaAlbaniaArgentinaArmeniaAsiaAustraliaAustriaBahamasBangladeshBarbadosBelarusBelgiumBelizeBoliviaBosnia and HerzegovinaBrazilBulgariaBurma/MyanmarCabo VerdeCambodiaCameroonCanadaCaribbeanCentral AmericaChileChinaColombiaCongoCosta RicaCroatiaCubaCzechoslovakiaDenmarkDominicaDominican RepublicEastern AfricaEastern AsiaEastern EuropeEcuadorEgyptEl SalvadorEnglandEritreaEthiopiaEuropeFijiFranceGermanyGhanaGreeceGrenadaGuatemalaGuyanaHaitiHondurasHong KongHungaryIndiaIndonesiaIranIraqIrelandIsraelItalyJamaicaJapanJordanKazakhstanKenyaKoreaKuwaitLaosLatin AmericaLatviaLebanonLiberiaLithuaniaMalaysiaMexicoMicronesiaMiddle AfricaMoldovaMoroccoNepalNetherlandsNicaraguaNigeriaNorth AmericaNorth MacedoniaNorthern AfricaNorthern EuropeNorwayOceaniaPakistanPanamaPeruPhilippinesPolandPortugalRomaniaRussiaSaudi ArabiaScotlandSenegalSerbiaSierra LeoneSingaporeSomaliaSouth AfricaSouth AmericaSouth Central AsiaSouth Eastern AsiaSouthern EuropeSpainSri LankaSt. Vincent and the GrenadinesSudanSwedenSwitzerlandSyriaTaiwanThailandTrinidad and TobagoTurkeyUgandaUkraineUruguayUzbekistanVenezuelaVietnamWest IndiesWestern AfricaWestern AsiaWestern EuropeYemenZaireZimbabweAzores
Finnish
Race
Ancestry
AfghanAfricanAlaska NativeAlaskan AthabascanAlbanianAleutAlsatianAmericanApacheArabArapahoArgentineanArmenianAssyrian/Chaldean/SyriacAustralianAustrianBahamianBangladeshiBarbadianBasqueBelgianBelizeanBermudanBhutaneseBlackfeetBolivianBrazilianBritishBritish West IndianBulgarianBurmeseCajunCambodianCanadianCape VerdeanCarpatho RusynCelticCentral AmericanCentral American IndianCherokeeCheyenneChickasawChileanChineseChippewaChoctawColombianColvilleComancheCosta RicanCreeCreekCroatianCrowCubanCypriotCzechCzechoslovakianDanishDelawareDominicanDutchDutch West IndianEastern EuropeanEcuadorianEgyptianEnglishEstonianEthiopianEuropeanFijianFilipinoFinnishFrenchFrench American IndianFrench CanadianGermanGerman RussianGhanaianGreekGuamanian/ChamorroGuatemalanGuyaneseHaitianHmongHonduranHopiHoumaHungarianIcelanderIndian (Asian)IndonesianInupiatIranianIraqiIrishIroquoisIsraeliItalianJamaicanJapaneseJordanianKenyanKiowaKoreanLaotianLatvianLebaneseLiberianLithuanianLumbeeLuxembourgerMacedonianMalaysianMalteseMarshalleseMenomineeMexicanMexican American IndianMongolianMoroccanNative HawaiianNavajoNepaleseNew ZealanderNicaraguanNigerianNorthern EuropeanNorwegianOkinawanOsageOttawaPaiutePakistaniPalestinianPanamanianParaguayanPennsylvania GermanPeruvianPimaPolishPortuguesePotawatomiPuebloPuerto RicanPuget Sound SalishRomanianRussianSalvadoranSamoanScandinavianScotch-IrishScottishSeminoleSenegaleseSerbianShoshoneSierra LeoneanSiouxSlavicSlovakSloveneSomaliSouth AfricanSouth AmericanSouth American IndianSoviet UnionSpaniardSpanishSpanish AmericanSpanish American IndianSri LankanSubsaharan AfricanSudaneseSwedishSwissSyrianTaiwaneseThaiTlingit-HaidaTohono O'OdhamTonganTrinidadian and TobagonianTsimshianTurkishU.S. Virgin IslanderUgandanUkrainianUruguayanUteVenezuelanVietnameseWelshWest IndianYakamaYaquiYugoslavianYumanYup'ikZimbabwean
Immigration
NonimmigrantsImmigrantsAfghanistanAfricaAlbaniaArgentinaArmeniaAsiaAustraliaAustriaBahamasBangladeshBarbadosBelarusBelgiumBelizeBoliviaBosnia and HerzegovinaBrazilBulgariaBurma/MyanmarCabo VerdeCambodiaCameroonCanadaCaribbeanCentral AmericaChileChinaColombiaCongoCosta RicaCroatiaCubaCzechoslovakiaDenmarkDominicaDominican RepublicEastern AfricaEastern AsiaEastern EuropeEcuadorEgyptEl SalvadorEnglandEritreaEthiopiaEuropeFijiFranceGermanyGhanaGreeceGrenadaGuatemalaGuyanaHaitiHondurasHong KongHungaryIndonesiaIranIraqIrelandIsraelItalyJamaicaJapanJordanKazakhstanKenyaKoreaKuwaitLaosLatin AmericaLatviaLebanonLiberiaLithuaniaMalaysiaMexicoMicronesiaMiddle AfricaMoldovaMoroccoNepalNetherlandsNicaraguaNigeriaNorth AmericaNorth MacedoniaNorthern AfricaNorthern EuropeNorwayOceaniaPakistanPanamaPeruPhilippinesPolandPortugalRomaniaRussiaSaudi ArabiaScotlandSenegalSerbiaSierra LeoneSingaporeSomaliaSouth AfricaSouth AmericaSouth Central AsiaSouth Eastern AsiaSouthern EuropeSpainSri LankaSt. Vincent and the GrenadinesSudanSwedenSwitzerlandSyriaTaiwanThailandTrinidad and TobagoTurkeyUgandaUkraineUruguayUzbekistanVenezuelaVietnamWest IndiesWestern AfricaWestern AsiaWestern EuropeYemenZaireZimbabweAzores
In Labor Force | Age 45-54
Income
Poverty
Unemployment
Labor Participation
Family Structure
Vehicle Availability
Education Level
Disability

In Labor Force | Age 45-54 Comparison

Immigrants from India

Finns

Exceptional
Excellent
84.7%
IN LABOR FORCE | AGE 45-54
100.0/ 100
METRIC RATING
6th/ 347
METRIC RANK
83.1%
IN LABOR FORCE | AGE 45-54
83.3/ 100
METRIC RATING
131st/ 347
METRIC RANK

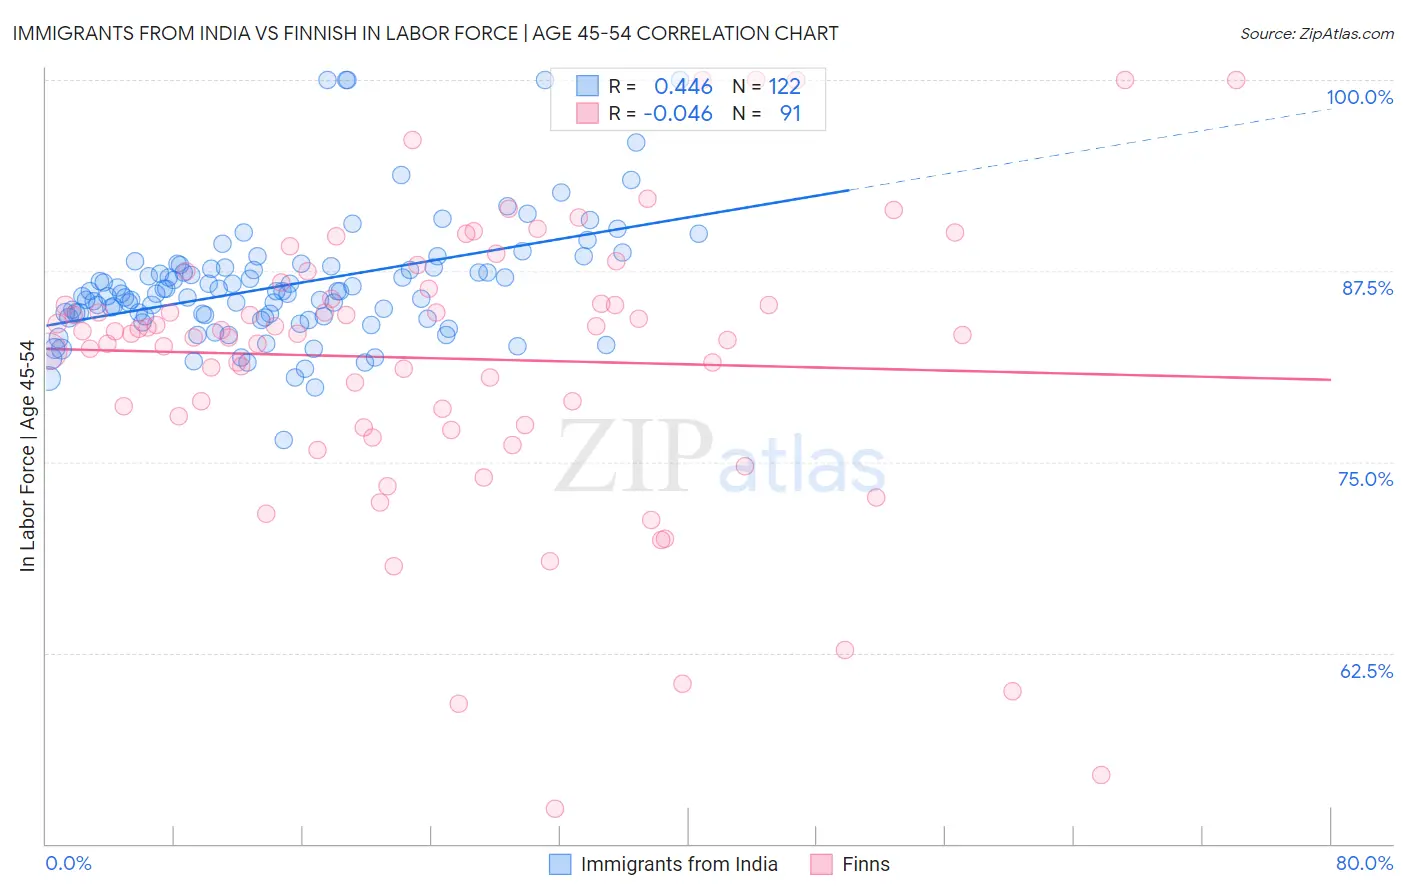
Immigrants from India vs Finnish In Labor Force | Age 45-54 Correlation Chart

The statistical analysis conducted on geographies consisting of 433,718,001 people shows a moderate positive correlation between the proportion of Immigrants from India and labor force participation rate among population between the ages 45 and 54 in the United States with a correlation coefficient (R) of 0.446 and weighted average of 84.7%. Similarly, the statistical analysis conducted on geographies consisting of 404,469,956 people shows no correlation between the proportion of Finns and labor force participation rate among population between the ages 45 and 54 in the United States with a correlation coefficient (R) of -0.046 and weighted average of 83.1%, a difference of 1.9%.
Immigrants from India vs Finnish In Labor Force | Age 45-54

In Labor Force | Age 45-54 Correlation Summary

MeasurementImmigrants from IndiaFinnish
Minimum76.4%52.3%
Maximum100.0%100.0%
Range23.6%47.7%
Mean86.5%81.8%
Median86.0%83.4%
Interquartile 25% (IQ1)84.5%77.4%
Interquartile 75% (IQ3)87.7%86.4%
Interquartile Range (IQR)3.2%8.9%
Standard Deviation (Sample)4.0%9.4%
Standard Deviation (Population)4.0%9.3%

Similar Demographics by In Labor Force | Age 45-54

Demographics Similar to Immigrants from India by In Labor Force | Age 45-54

In terms of in labor force | age 45-54, the demographic groups most similar to Immigrants from India are Immigrants from Cameroon (84.6%, a difference of 0.070%), Ethiopian (84.8%, a difference of 0.11%), Sierra Leonean (84.5%, a difference of 0.18%), Immigrants from Ethiopia (84.8%, a difference of 0.19%), and Immigrants from Sierra Leone (84.4%, a difference of 0.28%).
DemographicsRating | RankIn Labor Force | Age 45-54
Immigrants | Bolivia
100.0
/100
|
#1
Exceptional
85.3%
Luxembourgers
100.0
/100
|
#2
Exceptional
85.0%
Bolivians
100.0
/100
|
#3
Exceptional
84.9%
Immigrants | Ethiopia
100.0
/100
|
#4
Exceptional
84.8%
Ethiopians
100.0
/100
|
#5
Exceptional
84.8%
Immigrants | India
100.0
/100
|
#6
Exceptional
84.7%
Immigrants | Cameroon
100.0
/100
|
#7
Exceptional
84.6%
Sierra Leoneans
100.0
/100
|
#8
Exceptional
84.5%
Immigrants | Sierra Leone
100.0
/100
|
#9
Exceptional
84.4%
Norwegians
100.0
/100
|
#10
Exceptional
84.4%
Thais
100.0
/100
|
#11
Exceptional
84.3%
Bulgarians
100.0
/100
|
#12
Exceptional
84.2%
Chinese
99.9
/100
|
#13
Exceptional
84.1%
Cambodians
99.9
/100
|
#14
Exceptional
84.1%
Cypriots
99.9
/100
|
#15
Exceptional
84.1%

Demographics Similar to Finns by In Labor Force | Age 45-54

In terms of in labor force | age 45-54, the demographic groups most similar to Finns are Immigrants from Ukraine (83.0%, a difference of 0.010%), Liberian (83.0%, a difference of 0.010%), Immigrants from Israel (83.1%, a difference of 0.020%), Sudanese (83.0%, a difference of 0.020%), and Immigrants from Jordan (83.1%, a difference of 0.030%).
DemographicsRating | RankIn Labor Force | Age 45-54
Bermudans
88.0
/100
|
#124
Excellent
83.1%
Immigrants | Iran
87.2
/100
|
#125
Excellent
83.1%
Immigrants | Belgium
86.4
/100
|
#126
Excellent
83.1%
Immigrants | Jordan
85.2
/100
|
#127
Excellent
83.1%
Germans
85.1
/100
|
#128
Excellent
83.1%
Immigrants | Northern Europe
85.1
/100
|
#129
Excellent
83.1%
Immigrants | Israel
84.7
/100
|
#130
Excellent
83.1%
Finns
83.3
/100
|
#131
Excellent
83.1%
Immigrants | Ukraine
82.9
/100
|
#132
Excellent
83.0%
Liberians
82.7
/100
|
#133
Excellent
83.0%
Sudanese
82.0
/100
|
#134
Excellent
83.0%
Austrians
81.3
/100
|
#135
Excellent
83.0%
Immigrants | Kazakhstan
81.0
/100
|
#136
Excellent
83.0%
Immigrants | Spain
80.4
/100
|
#137
Excellent
83.0%
Ghanaians
79.5
/100
|
#138
Good
83.0%