Immigrants from Hungary vs English In Labor Force | Age 20-24

COMPARE

Immigrants from Hungary
Race
Ancestry
AfghanAfricanAlaska NativeAlaskan AthabascanAlbanianAleutAlsatianAmericanApacheArabArapahoArgentineanArmenianAssyrian/Chaldean/SyriacAustralianAustrianBahamianBangladeshiBarbadianBasqueBelgianBelizeanBermudanBhutaneseBlackfeetBolivianBrazilianBritishBritish West IndianBulgarianBurmeseCajunCambodianCanadianCape VerdeanCarpatho RusynCelticCentral AmericanCentral American IndianCherokeeCheyenneChickasawChileanChineseChippewaChoctawColombianColvilleComancheCosta RicanCreeCreekCroatianCrowCubanCypriotCzechCzechoslovakianDanishDelawareDominicanDutchDutch West IndianEastern EuropeanEcuadorianEgyptianEstonianEthiopianEuropeanFijianFilipinoFinnishFrenchFrench American IndianFrench CanadianGermanGerman RussianGhanaianGreekGuamanian/ChamorroGuatemalanGuyaneseHaitianHmongHonduranHopiHoumaHungarianIcelanderIndian (Asian)IndonesianInupiatIranianIraqiIrishIroquoisIsraeliItalianJamaicanJapaneseJordanianKenyanKiowaKoreanLaotianLatvianLebaneseLiberianLithuanianLumbeeLuxembourgerMacedonianMalaysianMalteseMarshalleseMenomineeMexicanMexican American IndianMongolianMoroccanNative HawaiianNavajoNepaleseNew ZealanderNicaraguanNigerianNorthern EuropeanNorwegianOkinawanOsageOttawaPaiutePakistaniPalestinianPanamanianParaguayanPennsylvania GermanPeruvianPimaPolishPortuguesePotawatomiPuebloPuerto RicanPuget Sound SalishRomanianRussianSalvadoranSamoanScandinavianScotch-IrishScottishSeminoleSenegaleseSerbianShoshoneSierra LeoneanSiouxSlavicSlovakSloveneSomaliSouth AfricanSouth AmericanSouth American IndianSoviet UnionSpaniardSpanishSpanish AmericanSpanish American IndianSri LankanSubsaharan AfricanSudaneseSwedishSwissSyrianTaiwaneseThaiTlingit-HaidaTohono O'OdhamTonganTrinidadian and TobagonianTsimshianTurkishU.S. Virgin IslanderUgandanUkrainianUruguayanUteVenezuelanVietnameseWelshWest IndianYakamaYaquiYugoslavianYumanYup'ikZimbabwean
Immigration
NonimmigrantsImmigrantsAfghanistanAfricaAlbaniaArgentinaArmeniaAsiaAustraliaAustriaBahamasBangladeshBarbadosBelarusBelgiumBelizeBoliviaBosnia and HerzegovinaBrazilBulgariaBurma/MyanmarCabo VerdeCambodiaCameroonCanadaCaribbeanCentral AmericaChileChinaColombiaCongoCosta RicaCroatiaCubaCzechoslovakiaDenmarkDominicaDominican RepublicEastern AfricaEastern AsiaEastern EuropeEcuadorEgyptEl SalvadorEnglandEritreaEthiopiaEuropeFijiFranceGermanyGhanaGreeceGrenadaGuatemalaGuyanaHaitiHondurasHong KongHungaryIndiaIndonesiaIranIraqIrelandIsraelItalyJamaicaJapanJordanKazakhstanKenyaKoreaKuwaitLaosLatin AmericaLatviaLebanonLiberiaLithuaniaMalaysiaMexicoMicronesiaMiddle AfricaMoldovaMoroccoNepalNetherlandsNicaraguaNigeriaNorth AmericaNorth MacedoniaNorthern AfricaNorthern EuropeNorwayOceaniaPakistanPanamaPeruPhilippinesPolandPortugalRomaniaRussiaSaudi ArabiaScotlandSenegalSerbiaSierra LeoneSingaporeSomaliaSouth AfricaSouth AmericaSouth Central AsiaSouth Eastern AsiaSouthern EuropeSpainSri LankaSt. Vincent and the GrenadinesSudanSwedenSwitzerlandSyriaTaiwanThailandTrinidad and TobagoTurkeyUgandaUkraineUruguayUzbekistanVenezuelaVietnamWest IndiesWestern AfricaWestern AsiaWestern EuropeYemenZaireZimbabweAzores
English
Race
Ancestry
AfghanAfricanAlaska NativeAlaskan AthabascanAlbanianAleutAlsatianAmericanApacheArabArapahoArgentineanArmenianAssyrian/Chaldean/SyriacAustralianAustrianBahamianBangladeshiBarbadianBasqueBelgianBelizeanBermudanBhutaneseBlackfeetBolivianBrazilianBritishBritish West IndianBulgarianBurmeseCajunCambodianCanadianCape VerdeanCarpatho RusynCelticCentral AmericanCentral American IndianCherokeeCheyenneChickasawChileanChineseChippewaChoctawColombianColvilleComancheCosta RicanCreeCreekCroatianCrowCubanCypriotCzechCzechoslovakianDanishDelawareDominicanDutchDutch West IndianEastern EuropeanEcuadorianEgyptianEnglishEstonianEthiopianEuropeanFijianFilipinoFinnishFrenchFrench American IndianFrench CanadianGermanGerman RussianGhanaianGreekGuamanian/ChamorroGuatemalanGuyaneseHaitianHmongHonduranHopiHoumaHungarianIcelanderIndian (Asian)IndonesianInupiatIranianIraqiIrishIroquoisIsraeliItalianJamaicanJapaneseJordanianKenyanKiowaKoreanLaotianLatvianLebaneseLiberianLithuanianLumbeeLuxembourgerMacedonianMalaysianMalteseMarshalleseMenomineeMexicanMexican American IndianMongolianMoroccanNative HawaiianNavajoNepaleseNew ZealanderNicaraguanNigerianNorthern EuropeanNorwegianOkinawanOsageOttawaPaiutePakistaniPalestinianPanamanianParaguayanPennsylvania GermanPeruvianPimaPolishPortuguesePotawatomiPuebloPuerto RicanPuget Sound SalishRomanianRussianSalvadoranSamoanScandinavianScotch-IrishScottishSeminoleSenegaleseSerbianShoshoneSierra LeoneanSiouxSlavicSlovakSloveneSomaliSouth AfricanSouth AmericanSouth American IndianSoviet UnionSpaniardSpanishSpanish AmericanSpanish American IndianSri LankanSubsaharan AfricanSudaneseSwedishSwissSyrianTaiwaneseThaiTlingit-HaidaTohono O'OdhamTonganTrinidadian and TobagonianTsimshianTurkishU.S. Virgin IslanderUgandanUkrainianUruguayanUteVenezuelanVietnameseWelshWest IndianYakamaYaquiYugoslavianYumanYup'ikZimbabwean
Immigration
NonimmigrantsImmigrantsAfghanistanAfricaAlbaniaArgentinaArmeniaAsiaAustraliaAustriaBahamasBangladeshBarbadosBelarusBelgiumBelizeBoliviaBosnia and HerzegovinaBrazilBulgariaBurma/MyanmarCabo VerdeCambodiaCameroonCanadaCaribbeanCentral AmericaChileChinaColombiaCongoCosta RicaCroatiaCubaCzechoslovakiaDenmarkDominicaDominican RepublicEastern AfricaEastern AsiaEastern EuropeEcuadorEgyptEl SalvadorEnglandEritreaEthiopiaEuropeFijiFranceGermanyGhanaGreeceGrenadaGuatemalaGuyanaHaitiHondurasHong KongIndiaIndonesiaIranIraqIrelandIsraelItalyJamaicaJapanJordanKazakhstanKenyaKoreaKuwaitLaosLatin AmericaLatviaLebanonLiberiaLithuaniaMalaysiaMexicoMicronesiaMiddle AfricaMoldovaMoroccoNepalNetherlandsNicaraguaNigeriaNorth AmericaNorth MacedoniaNorthern AfricaNorthern EuropeNorwayOceaniaPakistanPanamaPeruPhilippinesPolandPortugalRomaniaRussiaSaudi ArabiaScotlandSenegalSerbiaSierra LeoneSingaporeSomaliaSouth AfricaSouth AmericaSouth Central AsiaSouth Eastern AsiaSouthern EuropeSpainSri LankaSt. Vincent and the GrenadinesSudanSwedenSwitzerlandSyriaTaiwanThailandTrinidad and TobagoTurkeyUgandaUkraineUruguayUzbekistanVenezuelaVietnamWest IndiesWestern AfricaWestern AsiaWestern EuropeYemenZaireZimbabweAzores
In Labor Force | Age 20-24
Income
Poverty
Unemployment
Labor Participation
Family Structure
Vehicle Availability
Education Level
Disability

In Labor Force | Age 20-24 Comparison

Immigrants from Hungary

English

Fair
Exceptional
74.9%
IN LABOR FORCE | AGE 20-24
35.0/ 100
METRIC RATING
184th/ 347
METRIC RANK
77.6%
IN LABOR FORCE | AGE 20-24
100.0/ 100
METRIC RATING
32nd/ 347
METRIC RANK

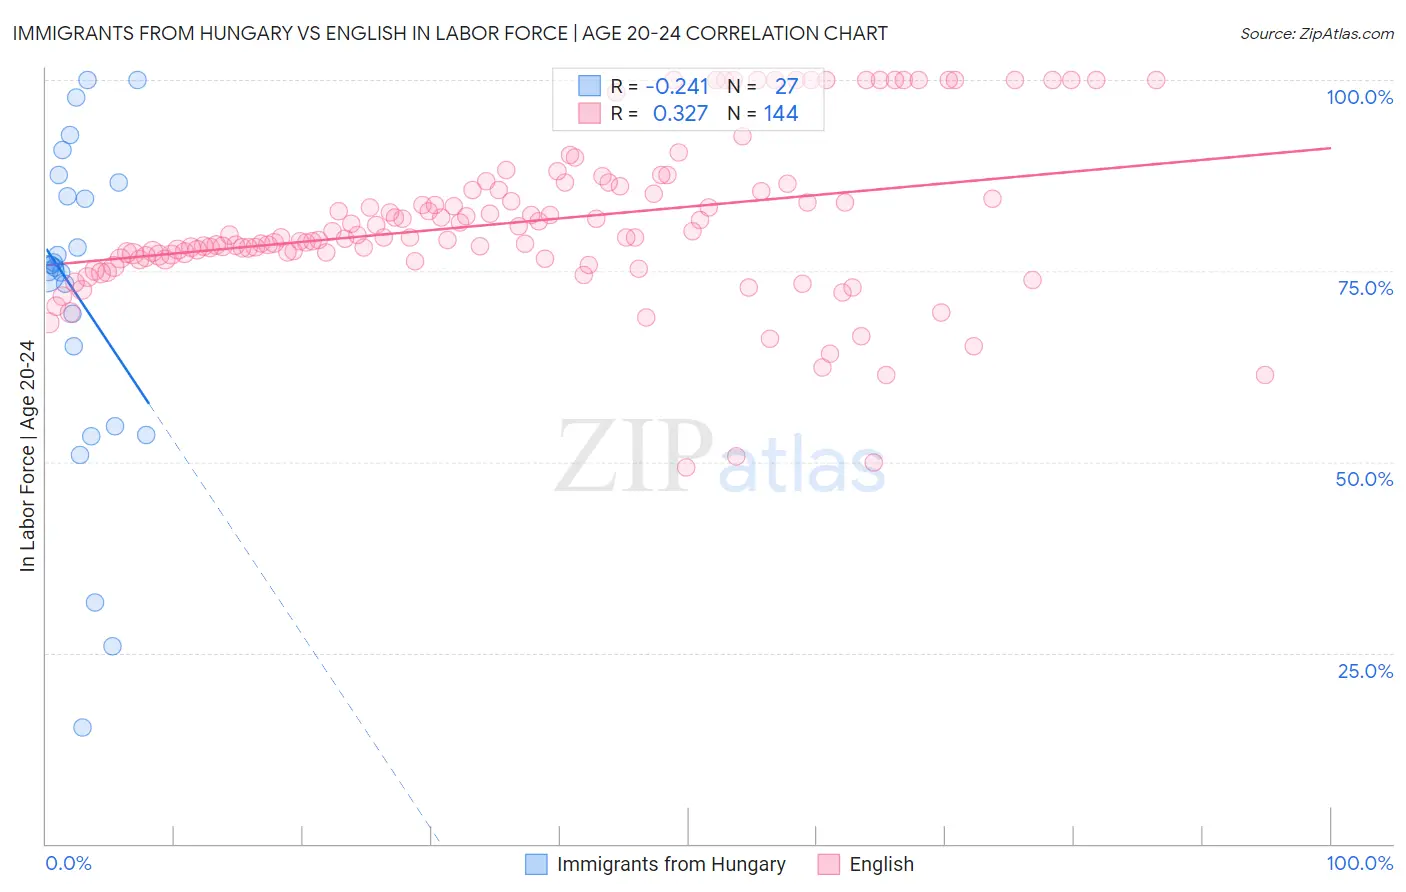
Immigrants from Hungary vs English In Labor Force | Age 20-24 Correlation Chart

The statistical analysis conducted on geographies consisting of 195,632,924 people shows a weak negative correlation between the proportion of Immigrants from Hungary and labor force participation rate among population between the ages 20 and 24 in the United States with a correlation coefficient (R) of -0.241 and weighted average of 74.9%. Similarly, the statistical analysis conducted on geographies consisting of 577,480,929 people shows a mild positive correlation between the proportion of English and labor force participation rate among population between the ages 20 and 24 in the United States with a correlation coefficient (R) of 0.327 and weighted average of 77.6%, a difference of 3.6%.
Immigrants from Hungary vs English In Labor Force | Age 20-24

In Labor Force | Age 20-24 Correlation Summary

MeasurementImmigrants from HungaryEnglish
Minimum15.2%49.2%
Maximum100.0%100.0%
Range84.8%50.8%
Mean71.3%81.4%
Median75.5%79.4%
Interquartile 25% (IQ1)54.6%76.8%
Interquartile 75% (IQ3)86.5%85.9%
Interquartile Range (IQR)31.9%9.1%
Standard Deviation (Sample)21.8%10.5%
Standard Deviation (Population)21.4%10.4%

Similar Demographics by In Labor Force | Age 20-24

Demographics Similar to Immigrants from Hungary by In Labor Force | Age 20-24

In terms of in labor force | age 20-24, the demographic groups most similar to Immigrants from Hungary are Sri Lankan (74.9%, a difference of 0.0%), Immigrants from Eastern Europe (74.9%, a difference of 0.020%), Immigrants from Honduras (74.9%, a difference of 0.020%), Immigrants from South Africa (74.9%, a difference of 0.030%), and Immigrants from Costa Rica (74.9%, a difference of 0.030%).
DemographicsRating | RankIn Labor Force | Age 20-24
Immigrants | Mexico
47.8
/100
|
#177
Average
75.0%
Immigrants | Central America
45.0
/100
|
#178
Average
75.0%
Immigrants | Latvia
44.1
/100
|
#179
Average
75.0%
Immigrants | Czechoslovakia
44.0
/100
|
#180
Average
75.0%
Africans
42.5
/100
|
#181
Average
75.0%
Immigrants | South Africa
36.9
/100
|
#182
Fair
74.9%
Immigrants | Costa Rica
36.7
/100
|
#183
Fair
74.9%
Immigrants | Hungary
35.0
/100
|
#184
Fair
74.9%
Sri Lankans
34.9
/100
|
#185
Fair
74.9%
Immigrants | Eastern Europe
33.8
/100
|
#186
Fair
74.9%
Immigrants | Honduras
33.5
/100
|
#187
Fair
74.9%
Hondurans
32.7
/100
|
#188
Fair
74.8%
Immigrants | Northern Europe
32.6
/100
|
#189
Fair
74.8%
Russians
32.2
/100
|
#190
Fair
74.8%
Senegalese
28.1
/100
|
#191
Fair
74.8%

Demographics Similar to English by In Labor Force | Age 20-24

In terms of in labor force | age 20-24, the demographic groups most similar to English are Immigrants from Ethiopia (77.5%, a difference of 0.050%), German Russian (77.5%, a difference of 0.050%), Polish (77.6%, a difference of 0.060%), Immigrants from Eastern Africa (77.5%, a difference of 0.070%), and Welsh (77.5%, a difference of 0.090%).
DemographicsRating | RankIn Labor Force | Age 20-24
Tlingit-Haida
100.0
/100
|
#25
Exceptional
77.9%
Tongans
100.0
/100
|
#26
Exceptional
77.9%
Immigrants | Micronesia
100.0
/100
|
#27
Exceptional
77.8%
Belgians
100.0
/100
|
#28
Exceptional
77.8%
Slovaks
100.0
/100
|
#29
Exceptional
77.7%
Swiss
100.0
/100
|
#30
Exceptional
77.7%
Poles
100.0
/100
|
#31
Exceptional
77.6%
English
100.0
/100
|
#32
Exceptional
77.6%
Immigrants | Ethiopia
100.0
/100
|
#33
Exceptional
77.5%
German Russians
100.0
/100
|
#34
Exceptional
77.5%
Immigrants | Eastern Africa
100.0
/100
|
#35
Exceptional
77.5%
Welsh
100.0
/100
|
#36
Exceptional
77.5%
Czechoslovakians
100.0
/100
|
#37
Exceptional
77.5%
Marshallese
100.0
/100
|
#38
Exceptional
77.4%
Irish
100.0
/100
|
#39
Exceptional
77.4%