Immigrants from Honduras vs Immigrants from Australia In Labor Force | Age 20-24
COMPARE
Immigrants from Honduras
Immigrants from Australia
In Labor Force | Age 20-24
In Labor Force | Age 20-24 Comparison
Immigrants from Honduras
Immigrants from Australia
74.9%
IN LABOR FORCE | AGE 20-24
33.5/ 100
METRIC RATING
187th/ 347
METRIC RANK
74.6%
IN LABOR FORCE | AGE 20-24
14.7/ 100
METRIC RATING
211th/ 347
METRIC RANK
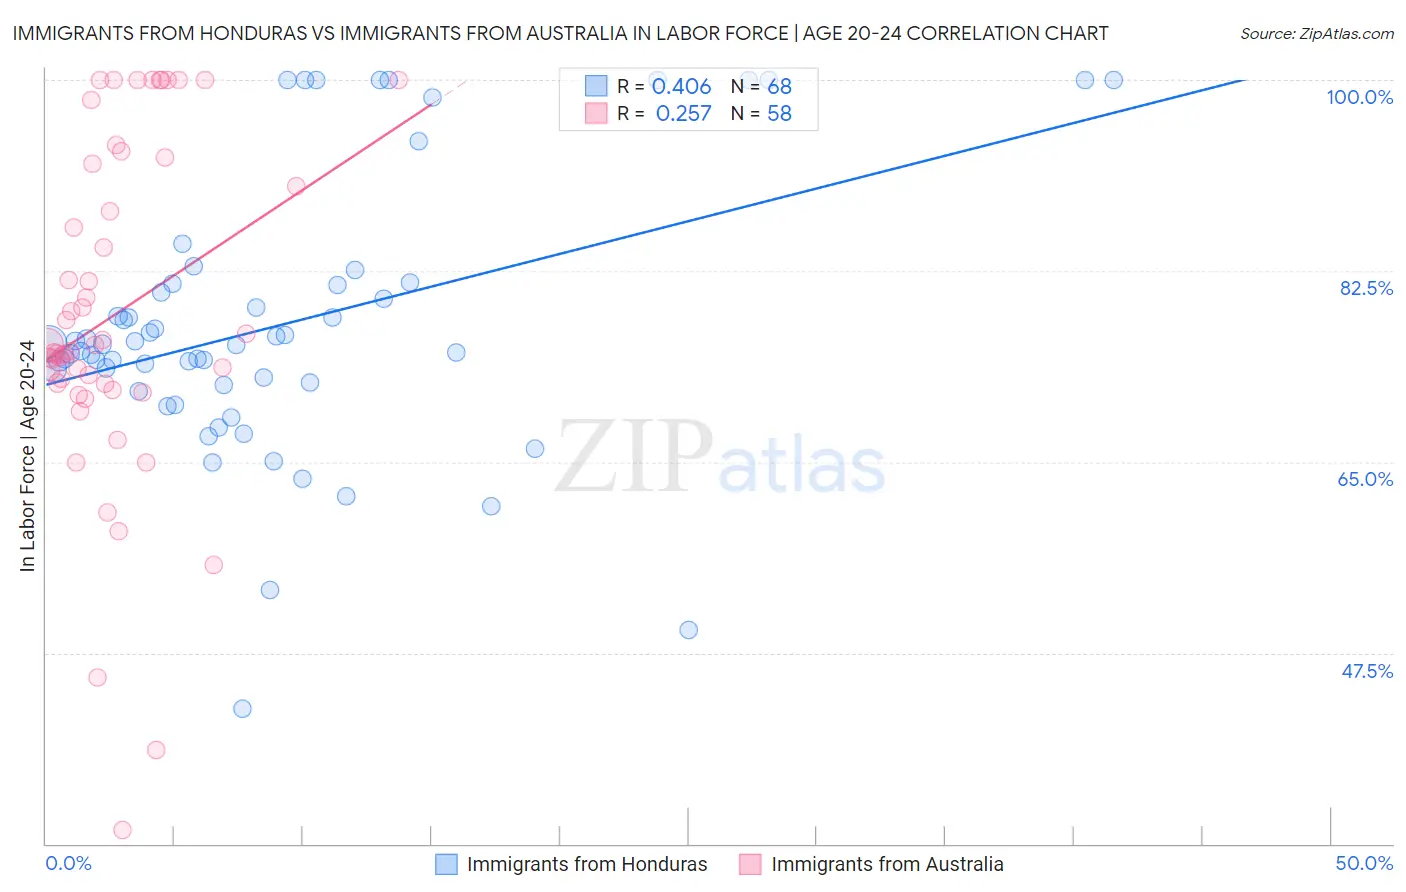
Immigrants from Honduras vs Immigrants from Australia In Labor Force | Age 20-24 Correlation Chart
The statistical analysis conducted on geographies consisting of 322,549,520 people shows a moderate positive correlation between the proportion of Immigrants from Honduras and labor force participation rate among population between the ages 20 and 24 in the United States with a correlation coefficient (R) of 0.406 and weighted average of 74.9%. Similarly, the statistical analysis conducted on geographies consisting of 227,133,823 people shows a weak positive correlation between the proportion of Immigrants from Australia and labor force participation rate among population between the ages 20 and 24 in the United States with a correlation coefficient (R) of 0.257 and weighted average of 74.6%, a difference of 0.39%.
In Labor Force | Age 20-24 Correlation Summary
| Measurement | Immigrants from Honduras | Immigrants from Australia |
| Minimum | 42.4% | 31.2% |
| Maximum | 100.0% | 100.0% |
| Range | 57.6% | 68.8% |
| Mean | 77.5% | 78.5% |
| Median | 75.7% | 75.4% |
| Interquartile 25% (IQ1) | 72.2% | 72.2% |
| Interquartile 75% (IQ3) | 81.3% | 92.3% |
| Interquartile Range (IQR) | 9.1% | 20.1% |
| Standard Deviation (Sample) | 12.5% | 15.4% |
| Standard Deviation (Population) | 12.4% | 15.3% |
Similar Demographics by In Labor Force | Age 20-24
Demographics Similar to Immigrants from Honduras by In Labor Force | Age 20-24
In terms of in labor force | age 20-24, the demographic groups most similar to Immigrants from Honduras are Immigrants from Eastern Europe (74.9%, a difference of 0.010%), Honduran (74.8%, a difference of 0.010%), Immigrants from Northern Europe (74.8%, a difference of 0.010%), Immigrants from Hungary (74.9%, a difference of 0.020%), and Sri Lankan (74.9%, a difference of 0.020%).
| Demographics | Rating | Rank | In Labor Force | Age 20-24 |
| Immigrants | Czechoslovakia | 44.0 /100 | #180 | Average 75.0% |
| Africans | 42.5 /100 | #181 | Average 75.0% |
| Immigrants | South Africa | 36.9 /100 | #182 | Fair 74.9% |
| Immigrants | Costa Rica | 36.7 /100 | #183 | Fair 74.9% |
| Immigrants | Hungary | 35.0 /100 | #184 | Fair 74.9% |
| Sri Lankans | 34.9 /100 | #185 | Fair 74.9% |
| Immigrants | Eastern Europe | 33.8 /100 | #186 | Fair 74.9% |
| Immigrants | Honduras | 33.5 /100 | #187 | Fair 74.9% |
| Hondurans | 32.7 /100 | #188 | Fair 74.8% |
| Immigrants | Northern Europe | 32.6 /100 | #189 | Fair 74.8% |
| Russians | 32.2 /100 | #190 | Fair 74.8% |
| Senegalese | 28.1 /100 | #191 | Fair 74.8% |
| Immigrants | Europe | 27.5 /100 | #192 | Fair 74.8% |
| Alsatians | 27.1 /100 | #193 | Fair 74.8% |
| Immigrants | Denmark | 25.8 /100 | #194 | Fair 74.8% |
Demographics Similar to Immigrants from Australia by In Labor Force | Age 20-24
In terms of in labor force | age 20-24, the demographic groups most similar to Immigrants from Australia are Uruguayan (74.6%, a difference of 0.010%), Immigrants from Uruguay (74.6%, a difference of 0.030%), Arab (74.6%, a difference of 0.030%), Albanian (74.6%, a difference of 0.040%), and Creek (74.5%, a difference of 0.040%).
| Demographics | Rating | Rank | In Labor Force | Age 20-24 |
| Immigrants | Italy | 17.6 /100 | #204 | Poor 74.6% |
| Inupiat | 17.6 /100 | #205 | Poor 74.6% |
| Sioux | 17.5 /100 | #206 | Poor 74.6% |
| Albanians | 16.2 /100 | #207 | Poor 74.6% |
| Immigrants | Uruguay | 15.8 /100 | #208 | Poor 74.6% |
| Arabs | 15.8 /100 | #209 | Poor 74.6% |
| Uruguayans | 15.1 /100 | #210 | Poor 74.6% |
| Immigrants | Australia | 14.7 /100 | #211 | Poor 74.6% |
| Creek | 13.3 /100 | #212 | Poor 74.5% |
| Peruvians | 13.3 /100 | #213 | Poor 74.5% |
| Immigrants | Southern Europe | 13.2 /100 | #214 | Poor 74.5% |
| Immigrants | Ghana | 12.7 /100 | #215 | Poor 74.5% |
| Immigrants | Kuwait | 12.7 /100 | #216 | Poor 74.5% |
| Chileans | 12.5 /100 | #217 | Poor 74.5% |
| Immigrants | Peru | 10.6 /100 | #218 | Poor 74.5% |