Immigrants from El Salvador vs Immigrants from Ukraine In Labor Force | Age 25-29

COMPARE

Immigrants from El Salvador
Race
Ancestry
AfghanAfricanAlaska NativeAlaskan AthabascanAlbanianAleutAlsatianAmericanApacheArabArapahoArgentineanArmenianAssyrian/Chaldean/SyriacAustralianAustrianBahamianBangladeshiBarbadianBasqueBelgianBelizeanBermudanBhutaneseBlackfeetBolivianBrazilianBritishBritish West IndianBulgarianBurmeseCajunCambodianCanadianCape VerdeanCarpatho RusynCelticCentral AmericanCentral American IndianCherokeeCheyenneChickasawChileanChineseChippewaChoctawColombianColvilleComancheCosta RicanCreeCreekCroatianCrowCubanCypriotCzechCzechoslovakianDanishDelawareDominicanDutchDutch West IndianEastern EuropeanEcuadorianEgyptianEnglishEstonianEthiopianEuropeanFijianFilipinoFinnishFrenchFrench American IndianFrench CanadianGermanGerman RussianGhanaianGreekGuamanian/ChamorroGuatemalanGuyaneseHaitianHmongHonduranHopiHoumaHungarianIcelanderIndian (Asian)IndonesianInupiatIranianIraqiIrishIroquoisIsraeliItalianJamaicanJapaneseJordanianKenyanKiowaKoreanLaotianLatvianLebaneseLiberianLithuanianLumbeeLuxembourgerMacedonianMalaysianMalteseMarshalleseMenomineeMexicanMexican American IndianMongolianMoroccanNative HawaiianNavajoNepaleseNew ZealanderNicaraguanNigerianNorthern EuropeanNorwegianOkinawanOsageOttawaPaiutePakistaniPalestinianPanamanianParaguayanPennsylvania GermanPeruvianPimaPolishPortuguesePotawatomiPuebloPuerto RicanPuget Sound SalishRomanianRussianSalvadoranSamoanScandinavianScotch-IrishScottishSeminoleSenegaleseSerbianShoshoneSierra LeoneanSiouxSlavicSlovakSloveneSomaliSouth AfricanSouth AmericanSouth American IndianSoviet UnionSpaniardSpanishSpanish AmericanSpanish American IndianSri LankanSubsaharan AfricanSudaneseSwedishSwissSyrianTaiwaneseThaiTlingit-HaidaTohono O'OdhamTonganTrinidadian and TobagonianTsimshianTurkishU.S. Virgin IslanderUgandanUkrainianUruguayanUteVenezuelanVietnameseWelshWest IndianYakamaYaquiYugoslavianYumanYup'ikZimbabwean
Immigration
NonimmigrantsImmigrantsAfghanistanAfricaAlbaniaArgentinaArmeniaAsiaAustraliaAustriaBahamasBangladeshBarbadosBelarusBelgiumBelizeBoliviaBosnia and HerzegovinaBrazilBulgariaBurma/MyanmarCabo VerdeCambodiaCameroonCanadaCaribbeanCentral AmericaChileChinaColombiaCongoCosta RicaCroatiaCubaCzechoslovakiaDenmarkDominicaDominican RepublicEastern AfricaEastern AsiaEastern EuropeEcuadorEgyptEl SalvadorEnglandEritreaEthiopiaEuropeFijiFranceGermanyGhanaGreeceGrenadaGuatemalaGuyanaHaitiHondurasHong KongHungaryIndiaIndonesiaIranIraqIrelandIsraelItalyJamaicaJapanJordanKazakhstanKenyaKoreaKuwaitLaosLatin AmericaLatviaLebanonLiberiaLithuaniaMalaysiaMexicoMicronesiaMiddle AfricaMoldovaMoroccoNepalNetherlandsNicaraguaNigeriaNorth AmericaNorth MacedoniaNorthern AfricaNorthern EuropeNorwayOceaniaPakistanPanamaPeruPhilippinesPolandPortugalRomaniaRussiaSaudi ArabiaScotlandSenegalSerbiaSierra LeoneSingaporeSomaliaSouth AfricaSouth AmericaSouth Central AsiaSouth Eastern AsiaSouthern EuropeSpainSri LankaSt. Vincent and the GrenadinesSudanSwedenSwitzerlandSyriaTaiwanThailandTrinidad and TobagoTurkeyUgandaUruguayUzbekistanVenezuelaVietnamWest IndiesWestern AfricaWestern AsiaWestern EuropeYemenZaireZimbabweAzores
Immigrants from Ukraine
Race
Ancestry
AfghanAfricanAlaska NativeAlaskan AthabascanAlbanianAleutAlsatianAmericanApacheArabArapahoArgentineanArmenianAssyrian/Chaldean/SyriacAustralianAustrianBahamianBangladeshiBarbadianBasqueBelgianBelizeanBermudanBhutaneseBlackfeetBolivianBrazilianBritishBritish West IndianBulgarianBurmeseCajunCambodianCanadianCape VerdeanCarpatho RusynCelticCentral AmericanCentral American IndianCherokeeCheyenneChickasawChileanChineseChippewaChoctawColombianColvilleComancheCosta RicanCreeCreekCroatianCrowCubanCypriotCzechCzechoslovakianDanishDelawareDominicanDutchDutch West IndianEastern EuropeanEcuadorianEgyptianEnglishEstonianEthiopianEuropeanFijianFilipinoFinnishFrenchFrench American IndianFrench CanadianGermanGerman RussianGhanaianGreekGuamanian/ChamorroGuatemalanGuyaneseHaitianHmongHonduranHopiHoumaHungarianIcelanderIndian (Asian)IndonesianInupiatIranianIraqiIrishIroquoisIsraeliItalianJamaicanJapaneseJordanianKenyanKiowaKoreanLaotianLatvianLebaneseLiberianLithuanianLumbeeLuxembourgerMacedonianMalaysianMalteseMarshalleseMenomineeMexicanMexican American IndianMongolianMoroccanNative HawaiianNavajoNepaleseNew ZealanderNicaraguanNigerianNorthern EuropeanNorwegianOkinawanOsageOttawaPaiutePakistaniPalestinianPanamanianParaguayanPennsylvania GermanPeruvianPimaPolishPortuguesePotawatomiPuebloPuerto RicanPuget Sound SalishRomanianRussianSalvadoranSamoanScandinavianScotch-IrishScottishSeminoleSenegaleseSerbianShoshoneSierra LeoneanSiouxSlavicSlovakSloveneSomaliSouth AfricanSouth AmericanSouth American IndianSoviet UnionSpaniardSpanishSpanish AmericanSpanish American IndianSri LankanSubsaharan AfricanSudaneseSwedishSwissSyrianTaiwaneseThaiTlingit-HaidaTohono O'OdhamTonganTrinidadian and TobagonianTsimshianTurkishU.S. Virgin IslanderUgandanUkrainianUruguayanUteVenezuelanVietnameseWelshWest IndianYakamaYaquiYugoslavianYumanYup'ikZimbabwean
Immigration
NonimmigrantsImmigrantsAfghanistanAfricaAlbaniaArgentinaArmeniaAsiaAustraliaAustriaBahamasBangladeshBarbadosBelarusBelgiumBelizeBoliviaBosnia and HerzegovinaBrazilBulgariaBurma/MyanmarCabo VerdeCambodiaCameroonCanadaCaribbeanCentral AmericaChileChinaColombiaCongoCosta RicaCroatiaCubaCzechoslovakiaDenmarkDominicaDominican RepublicEastern AfricaEastern AsiaEastern EuropeEcuadorEgyptEnglandEritreaEthiopiaEuropeFijiFranceGermanyGhanaGreeceGrenadaGuatemalaGuyanaHaitiHondurasHong KongHungaryIndiaIndonesiaIranIraqIrelandIsraelItalyJamaicaJapanJordanKazakhstanKenyaKoreaKuwaitLaosLatin AmericaLatviaLebanonLiberiaLithuaniaMalaysiaMexicoMicronesiaMiddle AfricaMoldovaMoroccoNepalNetherlandsNicaraguaNigeriaNorth AmericaNorth MacedoniaNorthern AfricaNorthern EuropeNorwayOceaniaPakistanPanamaPeruPhilippinesPolandPortugalRomaniaRussiaSaudi ArabiaScotlandSenegalSerbiaSierra LeoneSingaporeSomaliaSouth AfricaSouth AmericaSouth Central AsiaSouth Eastern AsiaSouthern EuropeSpainSri LankaSt. Vincent and the GrenadinesSudanSwedenSwitzerlandSyriaTaiwanThailandTrinidad and TobagoTurkeyUgandaUkraineUruguayUzbekistanVenezuelaVietnamWest IndiesWestern AfricaWestern AsiaWestern EuropeYemenZaireZimbabweAzores
In Labor Force | Age 25-29
Income
Poverty
Unemployment
Labor Participation
Family Structure
Vehicle Availability
Education Level
Disability

In Labor Force | Age 25-29 Comparison

Immigrants from El Salvador

Immigrants from Ukraine

Tragic
Fair
83.7%
IN LABOR FORCE | AGE 25-29
0.3/ 100
METRIC RATING
247th/ 347
METRIC RANK
84.5%
IN LABOR FORCE | AGE 25-29
33.7/ 100
METRIC RATING
188th/ 347
METRIC RANK

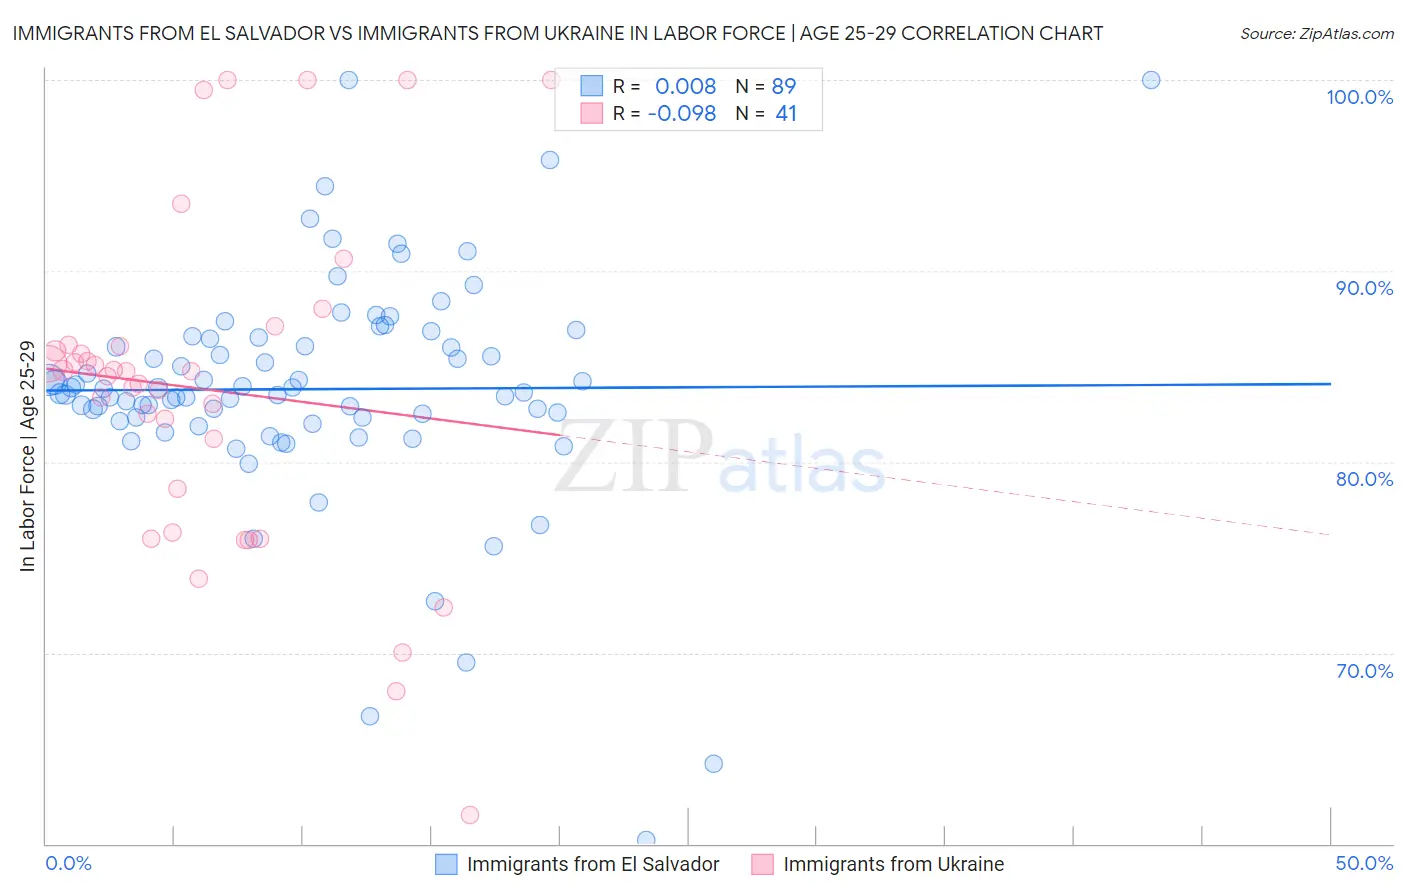
Immigrants from El Salvador vs Immigrants from Ukraine In Labor Force | Age 25-29 Correlation Chart

The statistical analysis conducted on geographies consisting of 357,714,097 people shows no correlation between the proportion of Immigrants from El Salvador and labor force participation rate among population between the ages 25 and 29 in the United States with a correlation coefficient (R) of 0.008 and weighted average of 83.7%. Similarly, the statistical analysis conducted on geographies consisting of 289,661,543 people shows a slight negative correlation between the proportion of Immigrants from Ukraine and labor force participation rate among population between the ages 25 and 29 in the United States with a correlation coefficient (R) of -0.098 and weighted average of 84.5%, a difference of 0.96%.
Immigrants from El Salvador vs Immigrants from Ukraine In Labor Force | Age 25-29

In Labor Force | Age 25-29 Correlation Summary

MeasurementImmigrants from El SalvadorImmigrants from Ukraine
Minimum60.2%61.5%
Maximum100.0%100.0%
Range39.8%38.5%
Mean83.8%83.8%
Median83.6%84.7%
Interquartile 25% (IQ1)82.2%77.5%
Interquartile 75% (IQ3)86.5%86.1%
Interquartile Range (IQR)4.2%8.6%
Standard Deviation (Sample)6.0%8.7%
Standard Deviation (Population)6.0%8.6%

Similar Demographics by In Labor Force | Age 25-29

Demographics Similar to Immigrants from El Salvador by In Labor Force | Age 25-29

In terms of in labor force | age 25-29, the demographic groups most similar to Immigrants from El Salvador are Cree (83.8%, a difference of 0.020%), Nonimmigrants (83.7%, a difference of 0.020%), Hmong (83.7%, a difference of 0.030%), Central American (83.7%, a difference of 0.040%), and Bahamian (83.7%, a difference of 0.060%).
DemographicsRating | RankIn Labor Force | Age 25-29
Trinidadians and Tobagonians
0.7
/100
|
#240
Tragic
83.9%
Alsatians
0.7
/100
|
#241
Tragic
83.9%
U.S. Virgin Islanders
0.6
/100
|
#242
Tragic
83.8%
Salvadorans
0.5
/100
|
#243
Tragic
83.8%
Immigrants | Jamaica
0.4
/100
|
#244
Tragic
83.8%
Iroquois
0.4
/100
|
#245
Tragic
83.8%
Cree
0.3
/100
|
#246
Tragic
83.8%
Immigrants | El Salvador
0.3
/100
|
#247
Tragic
83.7%
Immigrants | Nonimmigrants
0.3
/100
|
#248
Tragic
83.7%
Hmong
0.3
/100
|
#249
Tragic
83.7%
Central Americans
0.2
/100
|
#250
Tragic
83.7%
Bahamians
0.2
/100
|
#251
Tragic
83.7%
Guatemalans
0.2
/100
|
#252
Tragic
83.7%
Immigrants | Trinidad and Tobago
0.2
/100
|
#253
Tragic
83.7%
Spaniards
0.2
/100
|
#254
Tragic
83.7%

Demographics Similar to Immigrants from Ukraine by In Labor Force | Age 25-29

In terms of in labor force | age 25-29, the demographic groups most similar to Immigrants from Ukraine are Immigrants from Belgium (84.6%, a difference of 0.010%), Immigrants from Portugal (84.6%, a difference of 0.010%), Moroccan (84.5%, a difference of 0.010%), Welsh (84.5%, a difference of 0.020%), and Immigrants from Denmark (84.6%, a difference of 0.030%).
DemographicsRating | RankIn Labor Force | Age 25-29
Immigrants | Norway
41.9
/100
|
#181
Average
84.6%
Europeans
40.3
/100
|
#182
Average
84.6%
Scottish
40.1
/100
|
#183
Average
84.6%
Immigrants | Kuwait
38.2
/100
|
#184
Fair
84.6%
Immigrants | Denmark
37.0
/100
|
#185
Fair
84.6%
Immigrants | Belgium
35.0
/100
|
#186
Fair
84.6%
Immigrants | Portugal
34.7
/100
|
#187
Fair
84.6%
Immigrants | Ukraine
33.7
/100
|
#188
Fair
84.5%
Moroccans
32.6
/100
|
#189
Fair
84.5%
Welsh
31.1
/100
|
#190
Fair
84.5%
Zimbabweans
28.7
/100
|
#191
Fair
84.5%
English
25.8
/100
|
#192
Fair
84.5%
South American Indians
25.0
/100
|
#193
Fair
84.5%
Portuguese
21.2
/100
|
#194
Fair
84.4%
Immigrants | Israel
20.8
/100
|
#195
Fair
84.4%