Immigrants from Egypt vs Nicaraguan In Labor Force | Age 20-24
COMPARE
Immigrants from Egypt
Nicaraguan
In Labor Force | Age 20-24
In Labor Force | Age 20-24 Comparison
Immigrants from Egypt
Nicaraguans
73.8%
IN LABOR FORCE | AGE 20-24
1.2/ 100
METRIC RATING
251st/ 347
METRIC RANK
73.2%
IN LABOR FORCE | AGE 20-24
0.1/ 100
METRIC RATING
285th/ 347
METRIC RANK
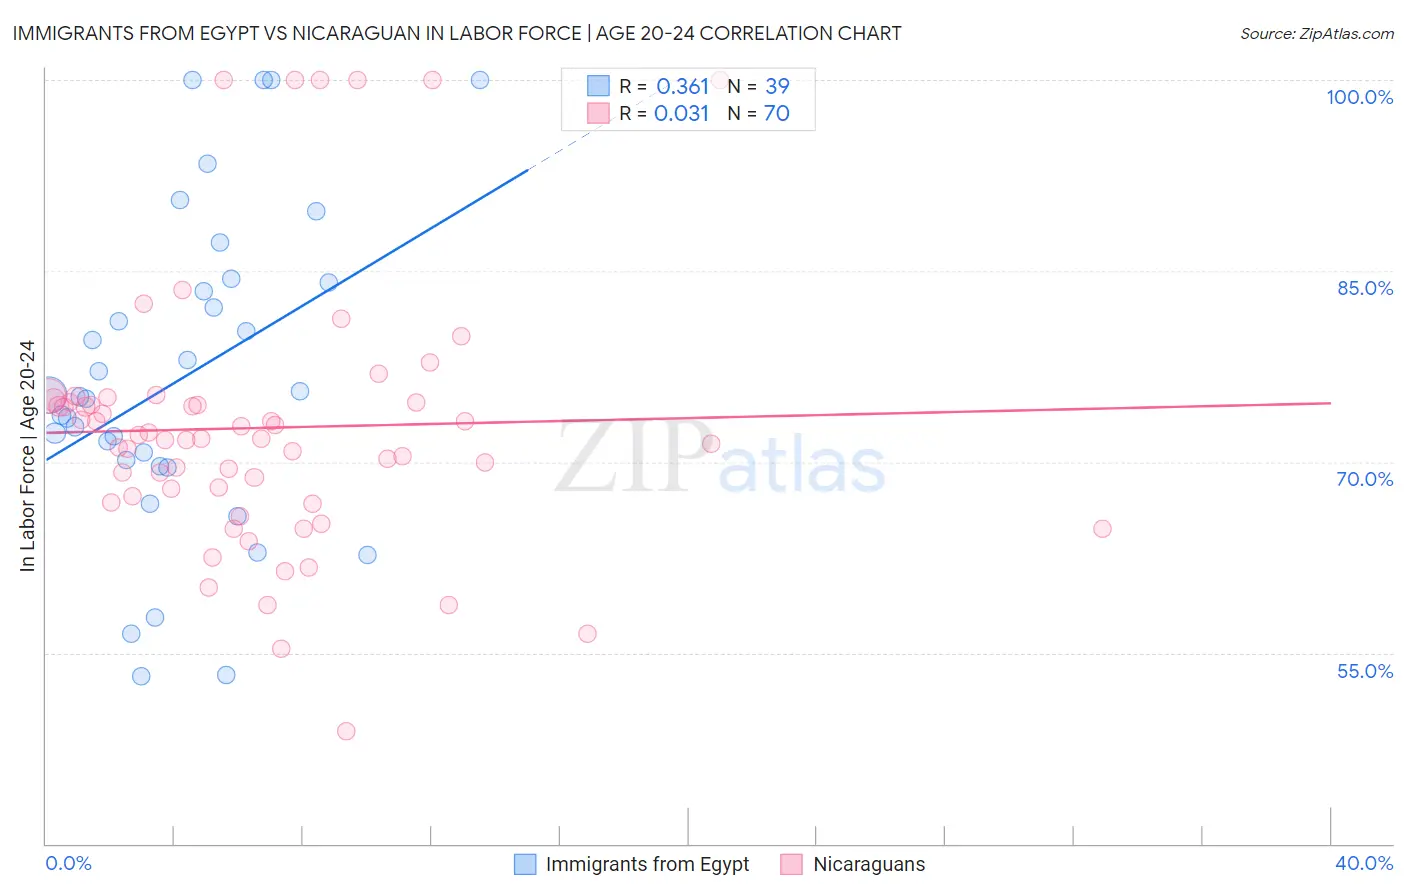
Immigrants from Egypt vs Nicaraguan In Labor Force | Age 20-24 Correlation Chart
The statistical analysis conducted on geographies consisting of 245,464,045 people shows a mild positive correlation between the proportion of Immigrants from Egypt and labor force participation rate among population between the ages 20 and 24 in the United States with a correlation coefficient (R) of 0.361 and weighted average of 73.8%. Similarly, the statistical analysis conducted on geographies consisting of 285,678,099 people shows no correlation between the proportion of Nicaraguans and labor force participation rate among population between the ages 20 and 24 in the United States with a correlation coefficient (R) of 0.031 and weighted average of 73.2%, a difference of 0.92%.
In Labor Force | Age 20-24 Correlation Summary
| Measurement | Immigrants from Egypt | Nicaraguan |
| Minimum | 53.2% | 48.8% |
| Maximum | 100.0% | 100.0% |
| Range | 46.8% | 51.2% |
| Mean | 76.6% | 72.7% |
| Median | 75.1% | 71.8% |
| Interquartile 25% (IQ1) | 69.7% | 67.3% |
| Interquartile 75% (IQ3) | 84.1% | 74.7% |
| Interquartile Range (IQR) | 14.4% | 7.4% |
| Standard Deviation (Sample) | 12.5% | 10.5% |
| Standard Deviation (Population) | 12.3% | 10.4% |
Similar Demographics by In Labor Force | Age 20-24
Demographics Similar to Immigrants from Egypt by In Labor Force | Age 20-24
In terms of in labor force | age 20-24, the demographic groups most similar to Immigrants from Egypt are Black/African American (73.9%, a difference of 0.020%), Immigrants from Belgium (73.9%, a difference of 0.020%), Immigrants from Kazakhstan (73.8%, a difference of 0.020%), Immigrants from Saudi Arabia (73.9%, a difference of 0.070%), and Arapaho (73.8%, a difference of 0.070%).
| Demographics | Rating | Rank | In Labor Force | Age 20-24 |
| Immigrants | South Central Asia | 1.9 /100 | #244 | Tragic 74.0% |
| Turks | 1.8 /100 | #245 | Tragic 73.9% |
| Immigrants | Panama | 1.6 /100 | #246 | Tragic 73.9% |
| Colville | 1.5 /100 | #247 | Tragic 73.9% |
| Immigrants | Saudi Arabia | 1.5 /100 | #248 | Tragic 73.9% |
| Blacks/African Americans | 1.3 /100 | #249 | Tragic 73.9% |
| Immigrants | Belgium | 1.3 /100 | #250 | Tragic 73.9% |
| Immigrants | Egypt | 1.2 /100 | #251 | Tragic 73.8% |
| Immigrants | Kazakhstan | 1.1 /100 | #252 | Tragic 73.8% |
| Arapaho | 1.0 /100 | #253 | Tragic 73.8% |
| Ute | 1.0 /100 | #254 | Tragic 73.8% |
| Immigrants | Pakistan | 0.9 /100 | #255 | Tragic 73.8% |
| Spanish American Indians | 0.8 /100 | #256 | Tragic 73.7% |
| Paraguayans | 0.8 /100 | #257 | Tragic 73.7% |
| Egyptians | 0.7 /100 | #258 | Tragic 73.7% |
Demographics Similar to Nicaraguans by In Labor Force | Age 20-24
In terms of in labor force | age 20-24, the demographic groups most similar to Nicaraguans are Immigrants from Lebanon (73.1%, a difference of 0.030%), Immigrants from Korea (73.1%, a difference of 0.050%), Kiowa (73.2%, a difference of 0.060%), Immigrants from Bahamas (73.2%, a difference of 0.080%), and Immigrants from Venezuela (73.2%, a difference of 0.090%).
| Demographics | Rating | Rank | In Labor Force | Age 20-24 |
| Cypriots | 0.2 /100 | #278 | Tragic 73.3% |
| Venezuelans | 0.2 /100 | #279 | Tragic 73.3% |
| Bahamians | 0.1 /100 | #280 | Tragic 73.3% |
| Immigrants | Venezuela | 0.1 /100 | #281 | Tragic 73.2% |
| Immigrants | Spain | 0.1 /100 | #282 | Tragic 73.2% |
| Immigrants | Bahamas | 0.1 /100 | #283 | Tragic 73.2% |
| Kiowa | 0.1 /100 | #284 | Tragic 73.2% |
| Nicaraguans | 0.1 /100 | #285 | Tragic 73.2% |
| Immigrants | Lebanon | 0.1 /100 | #286 | Tragic 73.1% |
| Immigrants | Korea | 0.1 /100 | #287 | Tragic 73.1% |
| Argentineans | 0.1 /100 | #288 | Tragic 73.1% |
| U.S. Virgin Islanders | 0.1 /100 | #289 | Tragic 73.0% |
| Immigrants | Belarus | 0.1 /100 | #290 | Tragic 73.0% |
| Immigrants | Nicaragua | 0.0 /100 | #291 | Tragic 72.9% |
| Pueblo | 0.0 /100 | #292 | Tragic 72.9% |