Immigrants from Dominican Republic vs Ukrainian In Labor Force | Age 30-34

COMPARE

Immigrants from Dominican Republic
Race
Ancestry
AfghanAfricanAlaska NativeAlaskan AthabascanAlbanianAleutAlsatianAmericanApacheArabArapahoArgentineanArmenianAssyrian/Chaldean/SyriacAustralianAustrianBahamianBangladeshiBarbadianBasqueBelgianBelizeanBermudanBhutaneseBlackfeetBolivianBrazilianBritishBritish West IndianBulgarianBurmeseCajunCambodianCanadianCape VerdeanCarpatho RusynCelticCentral AmericanCentral American IndianCherokeeCheyenneChickasawChileanChineseChippewaChoctawColombianColvilleComancheCosta RicanCreeCreekCroatianCrowCubanCypriotCzechCzechoslovakianDanishDelawareDominicanDutchDutch West IndianEastern EuropeanEcuadorianEgyptianEnglishEstonianEthiopianEuropeanFijianFilipinoFinnishFrenchFrench American IndianFrench CanadianGermanGerman RussianGhanaianGreekGuamanian/ChamorroGuatemalanGuyaneseHaitianHmongHonduranHopiHoumaHungarianIcelanderIndian (Asian)IndonesianInupiatIranianIraqiIrishIroquoisIsraeliItalianJamaicanJapaneseJordanianKenyanKiowaKoreanLaotianLatvianLebaneseLiberianLithuanianLumbeeLuxembourgerMacedonianMalaysianMalteseMarshalleseMenomineeMexicanMexican American IndianMongolianMoroccanNative HawaiianNavajoNepaleseNew ZealanderNicaraguanNigerianNorthern EuropeanNorwegianOkinawanOsageOttawaPaiutePakistaniPalestinianPanamanianParaguayanPennsylvania GermanPeruvianPimaPolishPortuguesePotawatomiPuebloPuerto RicanPuget Sound SalishRomanianRussianSalvadoranSamoanScandinavianScotch-IrishScottishSeminoleSenegaleseSerbianShoshoneSierra LeoneanSiouxSlavicSlovakSloveneSomaliSouth AfricanSouth AmericanSouth American IndianSoviet UnionSpaniardSpanishSpanish AmericanSpanish American IndianSri LankanSubsaharan AfricanSudaneseSwedishSwissSyrianTaiwaneseThaiTlingit-HaidaTohono O'OdhamTonganTrinidadian and TobagonianTsimshianTurkishU.S. Virgin IslanderUgandanUruguayanUteVenezuelanVietnameseWelshWest IndianYakamaYaquiYugoslavianYumanYup'ikZimbabwean
Immigration
NonimmigrantsImmigrantsAfghanistanAfricaAlbaniaArgentinaArmeniaAsiaAustraliaAustriaBahamasBangladeshBarbadosBelarusBelgiumBelizeBoliviaBosnia and HerzegovinaBrazilBulgariaBurma/MyanmarCabo VerdeCambodiaCameroonCanadaCaribbeanCentral AmericaChileChinaColombiaCongoCosta RicaCroatiaCubaCzechoslovakiaDenmarkDominicaDominican RepublicEastern AfricaEastern AsiaEastern EuropeEcuadorEgyptEl SalvadorEnglandEritreaEthiopiaEuropeFijiFranceGermanyGhanaGreeceGrenadaGuatemalaGuyanaHaitiHondurasHong KongHungaryIndiaIndonesiaIranIraqIrelandIsraelItalyJamaicaJapanJordanKazakhstanKenyaKoreaKuwaitLaosLatin AmericaLatviaLebanonLiberiaLithuaniaMalaysiaMexicoMicronesiaMiddle AfricaMoldovaMoroccoNepalNetherlandsNicaraguaNigeriaNorth AmericaNorth MacedoniaNorthern AfricaNorthern EuropeNorwayOceaniaPakistanPanamaPeruPhilippinesPolandPortugalRomaniaRussiaSaudi ArabiaScotlandSenegalSerbiaSierra LeoneSingaporeSomaliaSouth AfricaSouth AmericaSouth Central AsiaSouth Eastern AsiaSouthern EuropeSpainSri LankaSt. Vincent and the GrenadinesSudanSwedenSwitzerlandSyriaTaiwanThailandTrinidad and TobagoTurkeyUgandaUkraineUruguayUzbekistanVenezuelaVietnamWest IndiesWestern AfricaWestern AsiaWestern EuropeYemenZaireZimbabweAzores
Ukrainian
Race
Ancestry
AfghanAfricanAlaska NativeAlaskan AthabascanAlbanianAleutAlsatianAmericanApacheArabArapahoArgentineanArmenianAssyrian/Chaldean/SyriacAustralianAustrianBahamianBangladeshiBarbadianBasqueBelgianBelizeanBermudanBhutaneseBlackfeetBolivianBrazilianBritishBritish West IndianBulgarianBurmeseCajunCambodianCanadianCape VerdeanCarpatho RusynCelticCentral AmericanCentral American IndianCherokeeCheyenneChickasawChileanChineseChippewaChoctawColombianColvilleComancheCosta RicanCreeCreekCroatianCrowCubanCypriotCzechCzechoslovakianDanishDelawareDominicanDutchDutch West IndianEastern EuropeanEcuadorianEgyptianEnglishEstonianEthiopianEuropeanFijianFilipinoFinnishFrenchFrench American IndianFrench CanadianGermanGerman RussianGhanaianGreekGuamanian/ChamorroGuatemalanGuyaneseHaitianHmongHonduranHopiHoumaHungarianIcelanderIndian (Asian)IndonesianInupiatIranianIraqiIrishIroquoisIsraeliItalianJamaicanJapaneseJordanianKenyanKiowaKoreanLaotianLatvianLebaneseLiberianLithuanianLumbeeLuxembourgerMacedonianMalaysianMalteseMarshalleseMenomineeMexicanMexican American IndianMongolianMoroccanNative HawaiianNavajoNepaleseNew ZealanderNicaraguanNigerianNorthern EuropeanNorwegianOkinawanOsageOttawaPaiutePakistaniPalestinianPanamanianParaguayanPennsylvania GermanPeruvianPimaPolishPortuguesePotawatomiPuebloPuerto RicanPuget Sound SalishRomanianRussianSalvadoranSamoanScandinavianScotch-IrishScottishSeminoleSenegaleseSerbianShoshoneSierra LeoneanSiouxSlavicSlovakSloveneSomaliSouth AfricanSouth AmericanSouth American IndianSoviet UnionSpaniardSpanishSpanish AmericanSpanish American IndianSri LankanSubsaharan AfricanSudaneseSwedishSwissSyrianTaiwaneseThaiTlingit-HaidaTohono O'OdhamTonganTrinidadian and TobagonianTsimshianTurkishU.S. Virgin IslanderUgandanUkrainianUruguayanUteVenezuelanVietnameseWelshWest IndianYakamaYaquiYugoslavianYumanYup'ikZimbabwean
Immigration
NonimmigrantsImmigrantsAfghanistanAfricaAlbaniaArgentinaArmeniaAsiaAustraliaAustriaBahamasBangladeshBarbadosBelarusBelgiumBelizeBoliviaBosnia and HerzegovinaBrazilBulgariaBurma/MyanmarCabo VerdeCambodiaCameroonCanadaCaribbeanCentral AmericaChileChinaColombiaCongoCosta RicaCroatiaCubaCzechoslovakiaDenmarkDominicaEastern AfricaEastern AsiaEastern EuropeEcuadorEgyptEl SalvadorEnglandEritreaEthiopiaEuropeFijiFranceGermanyGhanaGreeceGrenadaGuatemalaGuyanaHaitiHondurasHong KongHungaryIndiaIndonesiaIranIraqIrelandIsraelItalyJamaicaJapanJordanKazakhstanKenyaKoreaKuwaitLaosLatin AmericaLatviaLebanonLiberiaLithuaniaMalaysiaMexicoMicronesiaMiddle AfricaMoldovaMoroccoNepalNetherlandsNicaraguaNigeriaNorth AmericaNorth MacedoniaNorthern AfricaNorthern EuropeNorwayOceaniaPakistanPanamaPeruPhilippinesPolandPortugalRomaniaRussiaSaudi ArabiaScotlandSenegalSerbiaSierra LeoneSingaporeSomaliaSouth AfricaSouth AmericaSouth Central AsiaSouth Eastern AsiaSouthern EuropeSpainSri LankaSt. Vincent and the GrenadinesSudanSwedenSwitzerlandSyriaTaiwanThailandTrinidad and TobagoTurkeyUgandaUkraineUruguayUzbekistanVenezuelaVietnamWest IndiesWestern AfricaWestern AsiaWestern EuropeYemenZaireZimbabweAzores
In Labor Force | Age 30-34
Income
Poverty
Unemployment
Labor Participation
Family Structure
Vehicle Availability
Education Level
Disability

In Labor Force | Age 30-34 Comparison

Immigrants from Dominican Republic

Ukrainians

Tragic
Exceptional
83.8%
IN LABOR FORCE | AGE 30-34
0.3/ 100
METRIC RATING
260th/ 347
METRIC RANK
85.2%
IN LABOR FORCE | AGE 30-34
96.6/ 100
METRIC RATING
103rd/ 347
METRIC RANK

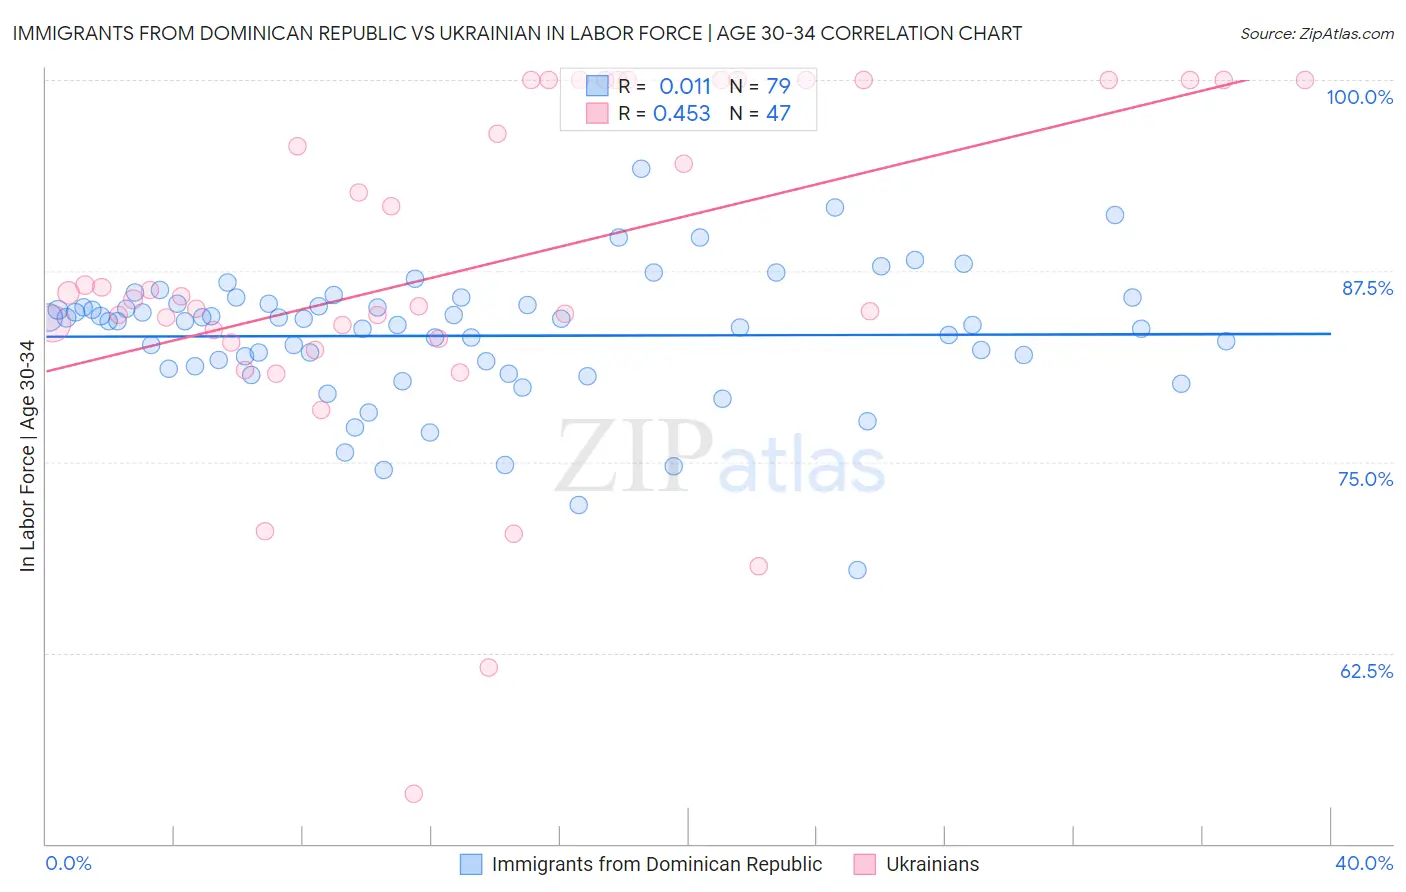
Immigrants from Dominican Republic vs Ukrainian In Labor Force | Age 30-34 Correlation Chart

The statistical analysis conducted on geographies consisting of 274,867,457 people shows no correlation between the proportion of Immigrants from Dominican Republic and labor force participation rate among population between the ages 30 and 34 in the United States with a correlation coefficient (R) of 0.011 and weighted average of 83.8%. Similarly, the statistical analysis conducted on geographies consisting of 448,215,384 people shows a moderate positive correlation between the proportion of Ukrainians and labor force participation rate among population between the ages 30 and 34 in the United States with a correlation coefficient (R) of 0.453 and weighted average of 85.2%, a difference of 1.7%.
Immigrants from Dominican Republic vs Ukrainian In Labor Force | Age 30-34

In Labor Force | Age 30-34 Correlation Summary

MeasurementImmigrants from Dominican RepublicUkrainian
Minimum67.9%53.3%
Maximum94.2%100.0%
Range26.3%46.7%
Mean83.3%87.8%
Median84.2%85.8%
Interquartile 25% (IQ1)81.2%83.0%
Interquartile 75% (IQ3)85.3%100.0%
Interquartile Range (IQR)4.1%17.0%
Standard Deviation (Sample)4.3%11.1%
Standard Deviation (Population)4.3%10.9%

Similar Demographics by In Labor Force | Age 30-34

Demographics Similar to Immigrants from Dominican Republic by In Labor Force | Age 30-34

In terms of in labor force | age 30-34, the demographic groups most similar to Immigrants from Dominican Republic are Guyanese (83.8%, a difference of 0.010%), Honduran (83.8%, a difference of 0.020%), Scotch-Irish (83.8%, a difference of 0.020%), Dominican (83.8%, a difference of 0.020%), and Immigrants from Guyana (83.8%, a difference of 0.030%).
DemographicsRating | RankIn Labor Force | Age 30-34
Immigrants | Nicaragua
0.6
/100
|
#253
Tragic
83.9%
Immigrants | St. Vincent and the Grenadines
0.5
/100
|
#254
Tragic
83.9%
Whites/Caucasians
0.5
/100
|
#255
Tragic
83.9%
Immigrants | Lebanon
0.4
/100
|
#256
Tragic
83.9%
Iraqis
0.3
/100
|
#257
Tragic
83.8%
Hondurans
0.3
/100
|
#258
Tragic
83.8%
Scotch-Irish
0.3
/100
|
#259
Tragic
83.8%
Immigrants | Dominican Republic
0.3
/100
|
#260
Tragic
83.8%
Guyanese
0.3
/100
|
#261
Tragic
83.8%
Dominicans
0.2
/100
|
#262
Tragic
83.8%
Immigrants | Guyana
0.2
/100
|
#263
Tragic
83.8%
Guatemalans
0.2
/100
|
#264
Tragic
83.7%
Immigrants | Honduras
0.1
/100
|
#265
Tragic
83.7%
Immigrants | Guatemala
0.1
/100
|
#266
Tragic
83.7%
Spaniards
0.1
/100
|
#267
Tragic
83.6%

Demographics Similar to Ukrainians by In Labor Force | Age 30-34

In terms of in labor force | age 30-34, the demographic groups most similar to Ukrainians are Immigrants from Ghana (85.2%, a difference of 0.0%), Immigrants from Austria (85.2%, a difference of 0.010%), Alsatian (85.2%, a difference of 0.010%), Immigrants from Middle Africa (85.2%, a difference of 0.010%), and Immigrants from Northern Africa (85.2%, a difference of 0.010%).
DemographicsRating | RankIn Labor Force | Age 30-34
Immigrants | Korea
97.3
/100
|
#96
Exceptional
85.2%
Thais
97.2
/100
|
#97
Exceptional
85.2%
Immigrants | Uganda
97.2
/100
|
#98
Exceptional
85.2%
Belgians
97.2
/100
|
#99
Exceptional
85.2%
Sudanese
97.1
/100
|
#100
Exceptional
85.2%
Immigrants | Belarus
96.9
/100
|
#101
Exceptional
85.2%
Immigrants | Austria
96.8
/100
|
#102
Exceptional
85.2%
Ukrainians
96.6
/100
|
#103
Exceptional
85.2%
Immigrants | Ghana
96.5
/100
|
#104
Exceptional
85.2%
Alsatians
96.3
/100
|
#105
Exceptional
85.2%
Immigrants | Middle Africa
96.3
/100
|
#106
Exceptional
85.2%
Immigrants | Northern Africa
96.3
/100
|
#107
Exceptional
85.2%
Immigrants | Zimbabwe
95.8
/100
|
#108
Exceptional
85.1%
Argentineans
95.8
/100
|
#109
Exceptional
85.1%
Immigrants | South Africa
95.3
/100
|
#110
Exceptional
85.1%