Immigrants from Dominica vs West Indian In Labor Force | Age 45-54
COMPARE
Immigrants from Dominica
West Indian
In Labor Force | Age 45-54
In Labor Force | Age 45-54 Comparison
Immigrants from Dominica
West Indians
80.8%
IN LABOR FORCE | AGE 45-54
0.0/ 100
METRIC RATING
286th/ 347
METRIC RANK
81.4%
IN LABOR FORCE | AGE 45-54
0.1/ 100
METRIC RATING
267th/ 347
METRIC RANK
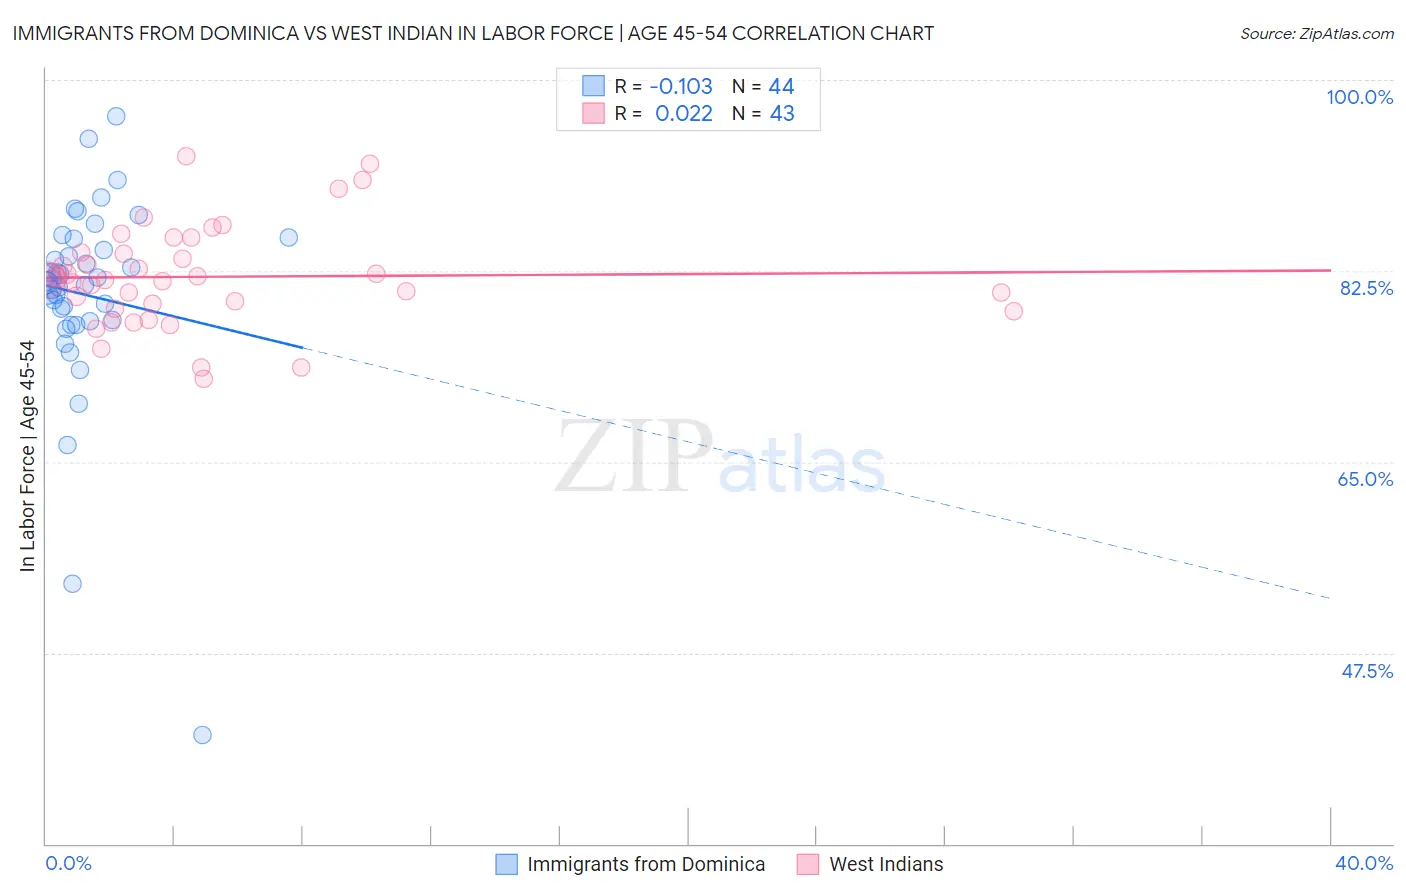
Immigrants from Dominica vs West Indian In Labor Force | Age 45-54 Correlation Chart
The statistical analysis conducted on geographies consisting of 83,783,911 people shows a poor negative correlation between the proportion of Immigrants from Dominica and labor force participation rate among population between the ages 45 and 54 in the United States with a correlation coefficient (R) of -0.103 and weighted average of 80.8%. Similarly, the statistical analysis conducted on geographies consisting of 253,868,267 people shows no correlation between the proportion of West Indians and labor force participation rate among population between the ages 45 and 54 in the United States with a correlation coefficient (R) of 0.022 and weighted average of 81.4%, a difference of 0.75%.
In Labor Force | Age 45-54 Correlation Summary
| Measurement | Immigrants from Dominica | West Indian |
| Minimum | 40.0% | 72.6% |
| Maximum | 96.7% | 93.0% |
| Range | 56.7% | 20.4% |
| Mean | 80.3% | 82.0% |
| Median | 81.5% | 81.7% |
| Interquartile 25% (IQ1) | 78.0% | 79.0% |
| Interquartile 75% (IQ3) | 85.0% | 84.2% |
| Interquartile Range (IQR) | 7.0% | 5.1% |
| Standard Deviation (Sample) | 9.4% | 4.6% |
| Standard Deviation (Population) | 9.3% | 4.6% |
Demographics Similar to Immigrants from Dominica and West Indians by In Labor Force | Age 45-54
In terms of in labor force | age 45-54, the demographic groups most similar to Immigrants from Dominica are Belizean (80.8%, a difference of 0.010%), Delaware (80.8%, a difference of 0.010%), French American Indian (80.8%, a difference of 0.060%), Aleut (81.0%, a difference of 0.23%), and Immigrants from Grenada (81.0%, a difference of 0.30%). Similarly, the demographic groups most similar to West Indians are Immigrants from St. Vincent and the Grenadines (81.4%, a difference of 0.0%), Immigrants from Honduras (81.4%, a difference of 0.020%), Alsatian (81.3%, a difference of 0.040%), Bangladeshi (81.3%, a difference of 0.070%), and Immigrants from Barbados (81.3%, a difference of 0.080%).
| Demographics | Rating | Rank | In Labor Force | Age 45-54 |
| Immigrants | St. Vincent and the Grenadines | 0.1 /100 | #266 | Tragic 81.4% |
| West Indians | 0.1 /100 | #267 | Tragic 81.4% |
| Immigrants | Honduras | 0.0 /100 | #268 | Tragic 81.4% |
| Alsatians | 0.0 /100 | #269 | Tragic 81.3% |
| Bangladeshis | 0.0 /100 | #270 | Tragic 81.3% |
| Immigrants | Barbados | 0.0 /100 | #271 | Tragic 81.3% |
| Spanish | 0.0 /100 | #272 | Tragic 81.3% |
| Chippewa | 0.0 /100 | #273 | Tragic 81.3% |
| British West Indians | 0.0 /100 | #274 | Tragic 81.2% |
| Immigrants | Nonimmigrants | 0.0 /100 | #275 | Tragic 81.2% |
| U.S. Virgin Islanders | 0.0 /100 | #276 | Tragic 81.2% |
| Guatemalans | 0.0 /100 | #277 | Tragic 81.2% |
| Immigrants | Guatemala | 0.0 /100 | #278 | Tragic 81.1% |
| Immigrants | Micronesia | 0.0 /100 | #279 | Tragic 81.1% |
| Immigrants | Latin America | 0.0 /100 | #280 | Tragic 81.0% |
| Immigrants | Grenada | 0.0 /100 | #281 | Tragic 81.0% |
| Aleuts | 0.0 /100 | #282 | Tragic 81.0% |
| French American Indians | 0.0 /100 | #283 | Tragic 80.8% |
| Belizeans | 0.0 /100 | #284 | Tragic 80.8% |
| Delaware | 0.0 /100 | #285 | Tragic 80.8% |
| Immigrants | Dominica | 0.0 /100 | #286 | Tragic 80.8% |