Immigrants from Costa Rica vs Ukrainian In Labor Force | Age 20-24

COMPARE

Immigrants from Costa Rica
Race
Ancestry
AfghanAfricanAlaska NativeAlaskan AthabascanAlbanianAleutAlsatianAmericanApacheArabArapahoArgentineanArmenianAssyrian/Chaldean/SyriacAustralianAustrianBahamianBangladeshiBarbadianBasqueBelgianBelizeanBermudanBhutaneseBlackfeetBolivianBrazilianBritishBritish West IndianBulgarianBurmeseCajunCambodianCanadianCape VerdeanCarpatho RusynCelticCentral AmericanCentral American IndianCherokeeCheyenneChickasawChileanChineseChippewaChoctawColombianColvilleComancheCosta RicanCreeCreekCroatianCrowCubanCypriotCzechCzechoslovakianDanishDelawareDominicanDutchDutch West IndianEastern EuropeanEcuadorianEgyptianEnglishEstonianEthiopianEuropeanFijianFilipinoFinnishFrenchFrench American IndianFrench CanadianGermanGerman RussianGhanaianGreekGuamanian/ChamorroGuatemalanGuyaneseHaitianHmongHonduranHopiHoumaHungarianIcelanderIndian (Asian)IndonesianInupiatIranianIraqiIrishIroquoisIsraeliItalianJamaicanJapaneseJordanianKenyanKiowaKoreanLaotianLatvianLebaneseLiberianLithuanianLumbeeLuxembourgerMacedonianMalaysianMalteseMarshalleseMenomineeMexicanMexican American IndianMongolianMoroccanNative HawaiianNavajoNepaleseNew ZealanderNicaraguanNigerianNorthern EuropeanNorwegianOkinawanOsageOttawaPaiutePakistaniPalestinianPanamanianParaguayanPennsylvania GermanPeruvianPimaPolishPortuguesePotawatomiPuebloPuerto RicanPuget Sound SalishRomanianRussianSalvadoranSamoanScandinavianScotch-IrishScottishSeminoleSenegaleseSerbianShoshoneSierra LeoneanSiouxSlavicSlovakSloveneSomaliSouth AfricanSouth AmericanSouth American IndianSoviet UnionSpaniardSpanishSpanish AmericanSpanish American IndianSri LankanSubsaharan AfricanSudaneseSwedishSwissSyrianTaiwaneseThaiTlingit-HaidaTohono O'OdhamTonganTrinidadian and TobagonianTsimshianTurkishU.S. Virgin IslanderUgandanUruguayanUteVenezuelanVietnameseWelshWest IndianYakamaYaquiYugoslavianYumanYup'ikZimbabwean
Immigration
NonimmigrantsImmigrantsAfghanistanAfricaAlbaniaArgentinaArmeniaAsiaAustraliaAustriaBahamasBangladeshBarbadosBelarusBelgiumBelizeBoliviaBosnia and HerzegovinaBrazilBulgariaBurma/MyanmarCabo VerdeCambodiaCameroonCanadaCaribbeanCentral AmericaChileChinaColombiaCongoCosta RicaCroatiaCubaCzechoslovakiaDenmarkDominicaDominican RepublicEastern AfricaEastern AsiaEastern EuropeEcuadorEgyptEl SalvadorEnglandEritreaEthiopiaEuropeFijiFranceGermanyGhanaGreeceGrenadaGuatemalaGuyanaHaitiHondurasHong KongHungaryIndiaIndonesiaIranIraqIrelandIsraelItalyJamaicaJapanJordanKazakhstanKenyaKoreaKuwaitLaosLatin AmericaLatviaLebanonLiberiaLithuaniaMalaysiaMexicoMicronesiaMiddle AfricaMoldovaMoroccoNepalNetherlandsNicaraguaNigeriaNorth AmericaNorth MacedoniaNorthern AfricaNorthern EuropeNorwayOceaniaPakistanPanamaPeruPhilippinesPolandPortugalRomaniaRussiaSaudi ArabiaScotlandSenegalSerbiaSierra LeoneSingaporeSomaliaSouth AfricaSouth AmericaSouth Central AsiaSouth Eastern AsiaSouthern EuropeSpainSri LankaSt. Vincent and the GrenadinesSudanSwedenSwitzerlandSyriaTaiwanThailandTrinidad and TobagoTurkeyUgandaUkraineUruguayUzbekistanVenezuelaVietnamWest IndiesWestern AfricaWestern AsiaWestern EuropeYemenZaireZimbabweAzores
Ukrainian
Race
Ancestry
AfghanAfricanAlaska NativeAlaskan AthabascanAlbanianAleutAlsatianAmericanApacheArabArapahoArgentineanArmenianAssyrian/Chaldean/SyriacAustralianAustrianBahamianBangladeshiBarbadianBasqueBelgianBelizeanBermudanBhutaneseBlackfeetBolivianBrazilianBritishBritish West IndianBulgarianBurmeseCajunCambodianCanadianCape VerdeanCarpatho RusynCelticCentral AmericanCentral American IndianCherokeeCheyenneChickasawChileanChineseChippewaChoctawColombianColvilleComancheCosta RicanCreeCreekCroatianCrowCubanCypriotCzechCzechoslovakianDanishDelawareDominicanDutchDutch West IndianEastern EuropeanEcuadorianEgyptianEnglishEstonianEthiopianEuropeanFijianFilipinoFinnishFrenchFrench American IndianFrench CanadianGermanGerman RussianGhanaianGreekGuamanian/ChamorroGuatemalanGuyaneseHaitianHmongHonduranHopiHoumaHungarianIcelanderIndian (Asian)IndonesianInupiatIranianIraqiIrishIroquoisIsraeliItalianJamaicanJapaneseJordanianKenyanKiowaKoreanLaotianLatvianLebaneseLiberianLithuanianLumbeeLuxembourgerMacedonianMalaysianMalteseMarshalleseMenomineeMexicanMexican American IndianMongolianMoroccanNative HawaiianNavajoNepaleseNew ZealanderNicaraguanNigerianNorthern EuropeanNorwegianOkinawanOsageOttawaPaiutePakistaniPalestinianPanamanianParaguayanPennsylvania GermanPeruvianPimaPolishPortuguesePotawatomiPuebloPuerto RicanPuget Sound SalishRomanianRussianSalvadoranSamoanScandinavianScotch-IrishScottishSeminoleSenegaleseSerbianShoshoneSierra LeoneanSiouxSlavicSlovakSloveneSomaliSouth AfricanSouth AmericanSouth American IndianSoviet UnionSpaniardSpanishSpanish AmericanSpanish American IndianSri LankanSubsaharan AfricanSudaneseSwedishSwissSyrianTaiwaneseThaiTlingit-HaidaTohono O'OdhamTonganTrinidadian and TobagonianTsimshianTurkishU.S. Virgin IslanderUgandanUkrainianUruguayanUteVenezuelanVietnameseWelshWest IndianYakamaYaquiYugoslavianYumanYup'ikZimbabwean
Immigration
NonimmigrantsImmigrantsAfghanistanAfricaAlbaniaArgentinaArmeniaAsiaAustraliaAustriaBahamasBangladeshBarbadosBelarusBelgiumBelizeBoliviaBosnia and HerzegovinaBrazilBulgariaBurma/MyanmarCabo VerdeCambodiaCameroonCanadaCaribbeanCentral AmericaChileChinaColombiaCongoCroatiaCubaCzechoslovakiaDenmarkDominicaDominican RepublicEastern AfricaEastern AsiaEastern EuropeEcuadorEgyptEl SalvadorEnglandEritreaEthiopiaEuropeFijiFranceGermanyGhanaGreeceGrenadaGuatemalaGuyanaHaitiHondurasHong KongHungaryIndiaIndonesiaIranIraqIrelandIsraelItalyJamaicaJapanJordanKazakhstanKenyaKoreaKuwaitLaosLatin AmericaLatviaLebanonLiberiaLithuaniaMalaysiaMexicoMicronesiaMiddle AfricaMoldovaMoroccoNepalNetherlandsNicaraguaNigeriaNorth AmericaNorth MacedoniaNorthern AfricaNorthern EuropeNorwayOceaniaPakistanPanamaPeruPhilippinesPolandPortugalRomaniaRussiaSaudi ArabiaScotlandSenegalSerbiaSierra LeoneSingaporeSomaliaSouth AfricaSouth AmericaSouth Central AsiaSouth Eastern AsiaSouthern EuropeSpainSri LankaSt. Vincent and the GrenadinesSudanSwedenSwitzerlandSyriaTaiwanThailandTrinidad and TobagoTurkeyUgandaUkraineUruguayUzbekistanVenezuelaVietnamWest IndiesWestern AfricaWestern AsiaWestern EuropeYemenZaireZimbabweAzores
In Labor Force | Age 20-24
Income
Poverty
Unemployment
Labor Participation
Family Structure
Vehicle Availability
Education Level
Disability

In Labor Force | Age 20-24 Comparison

Immigrants from Costa Rica

Ukrainians

Fair
Exceptional
74.9%
IN LABOR FORCE | AGE 20-24
36.7/ 100
METRIC RATING
183rd/ 347
METRIC RANK
75.9%
IN LABOR FORCE | AGE 20-24
95.7/ 100
METRIC RATING
111th/ 347
METRIC RANK

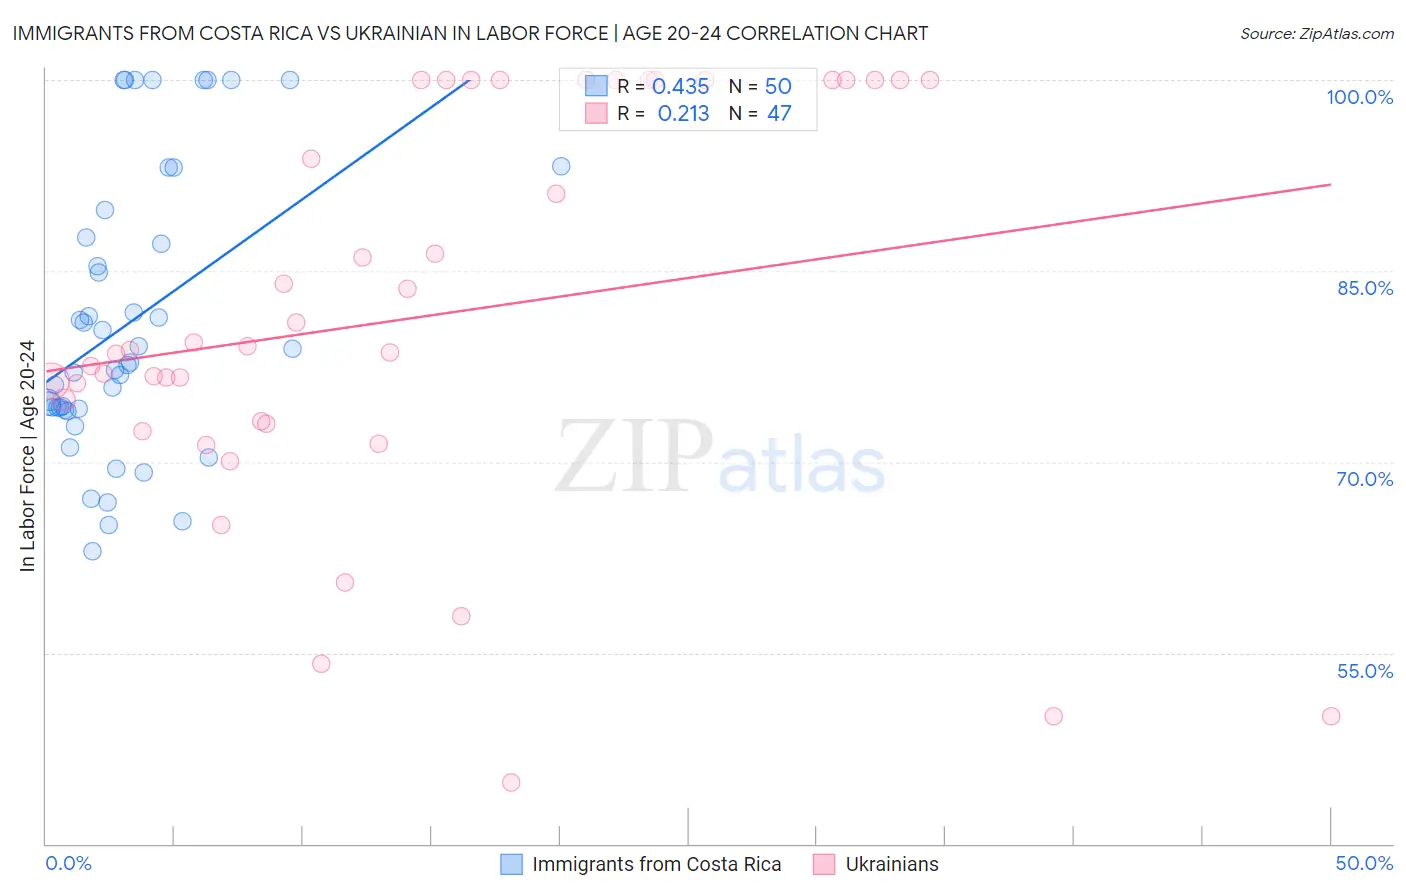
Immigrants from Costa Rica vs Ukrainian In Labor Force | Age 20-24 Correlation Chart

The statistical analysis conducted on geographies consisting of 204,265,207 people shows a moderate positive correlation between the proportion of Immigrants from Costa Rica and labor force participation rate among population between the ages 20 and 24 in the United States with a correlation coefficient (R) of 0.435 and weighted average of 74.9%. Similarly, the statistical analysis conducted on geographies consisting of 448,349,604 people shows a weak positive correlation between the proportion of Ukrainians and labor force participation rate among population between the ages 20 and 24 in the United States with a correlation coefficient (R) of 0.213 and weighted average of 75.9%, a difference of 1.3%.
Immigrants from Costa Rica vs Ukrainian In Labor Force | Age 20-24

In Labor Force | Age 20-24 Correlation Summary

MeasurementImmigrants from Costa RicaUkrainian
Minimum63.0%44.8%
Maximum100.0%100.0%
Range37.0%55.2%
Mean80.9%81.4%
Median77.7%78.8%
Interquartile 25% (IQ1)74.2%73.0%
Interquartile 75% (IQ3)87.6%100.0%
Interquartile Range (IQR)13.4%27.0%
Standard Deviation (Sample)10.9%15.6%
Standard Deviation (Population)10.8%15.5%

Similar Demographics by In Labor Force | Age 20-24

Demographics Similar to Immigrants from Costa Rica by In Labor Force | Age 20-24

In terms of in labor force | age 20-24, the demographic groups most similar to Immigrants from Costa Rica are Immigrants from South Africa (74.9%, a difference of 0.0%), Immigrants from Hungary (74.9%, a difference of 0.030%), Sri Lankan (74.9%, a difference of 0.030%), Immigrants from Eastern Europe (74.9%, a difference of 0.050%), and Immigrants from Honduras (74.9%, a difference of 0.050%).
DemographicsRating | RankIn Labor Force | Age 20-24
Central Americans
48.7
/100
|
#176
Average
75.0%
Immigrants | Mexico
47.8
/100
|
#177
Average
75.0%
Immigrants | Central America
45.0
/100
|
#178
Average
75.0%
Immigrants | Latvia
44.1
/100
|
#179
Average
75.0%
Immigrants | Czechoslovakia
44.0
/100
|
#180
Average
75.0%
Africans
42.5
/100
|
#181
Average
75.0%
Immigrants | South Africa
36.9
/100
|
#182
Fair
74.9%
Immigrants | Costa Rica
36.7
/100
|
#183
Fair
74.9%
Immigrants | Hungary
35.0
/100
|
#184
Fair
74.9%
Sri Lankans
34.9
/100
|
#185
Fair
74.9%
Immigrants | Eastern Europe
33.8
/100
|
#186
Fair
74.9%
Immigrants | Honduras
33.5
/100
|
#187
Fair
74.9%
Hondurans
32.7
/100
|
#188
Fair
74.8%
Immigrants | Northern Europe
32.6
/100
|
#189
Fair
74.8%
Russians
32.2
/100
|
#190
Fair
74.8%

Demographics Similar to Ukrainians by In Labor Force | Age 20-24

In terms of in labor force | age 20-24, the demographic groups most similar to Ukrainians are Cherokee (75.9%, a difference of 0.010%), Immigrants from Morocco (75.9%, a difference of 0.010%), Immigrants from Canada (75.9%, a difference of 0.010%), Immigrants from Netherlands (75.9%, a difference of 0.040%), and Immigrants from Zimbabwe (75.9%, a difference of 0.050%).
DemographicsRating | RankIn Labor Force | Age 20-24
Macedonians
97.2
/100
|
#104
Exceptional
76.0%
Immigrants | Nepal
97.2
/100
|
#105
Exceptional
76.0%
Immigrants | Uganda
97.1
/100
|
#106
Exceptional
76.0%
Greeks
96.9
/100
|
#107
Exceptional
76.0%
Iraqis
96.6
/100
|
#108
Exceptional
76.0%
Cherokee
95.8
/100
|
#109
Exceptional
75.9%
Immigrants | Morocco
95.8
/100
|
#110
Exceptional
75.9%
Ukrainians
95.7
/100
|
#111
Exceptional
75.9%
Immigrants | Canada
95.6
/100
|
#112
Exceptional
75.9%
Immigrants | Netherlands
95.3
/100
|
#113
Exceptional
75.9%
Immigrants | Zimbabwe
95.1
/100
|
#114
Exceptional
75.9%
Alaska Natives
95.1
/100
|
#115
Exceptional
75.9%
Immigrants | North America
95.0
/100
|
#116
Exceptional
75.9%
Assyrians/Chaldeans/Syriacs
94.9
/100
|
#117
Exceptional
75.9%
Spanish Americans
94.8
/100
|
#118
Exceptional
75.8%