Immigrants from Colombia vs Potawatomi In Labor Force | Age 30-34

COMPARE

Immigrants from Colombia
Race
Ancestry
AfghanAfricanAlaska NativeAlaskan AthabascanAlbanianAleutAlsatianAmericanApacheArabArapahoArgentineanArmenianAssyrian/Chaldean/SyriacAustralianAustrianBahamianBangladeshiBarbadianBasqueBelgianBelizeanBermudanBhutaneseBlackfeetBolivianBrazilianBritishBritish West IndianBulgarianBurmeseCajunCambodianCanadianCape VerdeanCarpatho RusynCelticCentral AmericanCentral American IndianCherokeeCheyenneChickasawChileanChineseChippewaChoctawColombianColvilleComancheCosta RicanCreeCreekCroatianCrowCubanCypriotCzechCzechoslovakianDanishDelawareDominicanDutchDutch West IndianEastern EuropeanEcuadorianEgyptianEnglishEstonianEthiopianEuropeanFijianFilipinoFinnishFrenchFrench American IndianFrench CanadianGermanGerman RussianGhanaianGreekGuamanian/ChamorroGuatemalanGuyaneseHaitianHmongHonduranHopiHoumaHungarianIcelanderIndian (Asian)IndonesianInupiatIranianIraqiIrishIroquoisIsraeliItalianJamaicanJapaneseJordanianKenyanKiowaKoreanLaotianLatvianLebaneseLiberianLithuanianLumbeeLuxembourgerMacedonianMalaysianMalteseMarshalleseMenomineeMexicanMexican American IndianMongolianMoroccanNative HawaiianNavajoNepaleseNew ZealanderNicaraguanNigerianNorthern EuropeanNorwegianOkinawanOsageOttawaPaiutePakistaniPalestinianPanamanianParaguayanPennsylvania GermanPeruvianPimaPolishPortuguesePuebloPuerto RicanPuget Sound SalishRomanianRussianSalvadoranSamoanScandinavianScotch-IrishScottishSeminoleSenegaleseSerbianShoshoneSierra LeoneanSiouxSlavicSlovakSloveneSomaliSouth AfricanSouth AmericanSouth American IndianSoviet UnionSpaniardSpanishSpanish AmericanSpanish American IndianSri LankanSubsaharan AfricanSudaneseSwedishSwissSyrianTaiwaneseThaiTlingit-HaidaTohono O'OdhamTonganTrinidadian and TobagonianTsimshianTurkishU.S. Virgin IslanderUgandanUkrainianUruguayanUteVenezuelanVietnameseWelshWest IndianYakamaYaquiYugoslavianYumanYup'ikZimbabwean
Immigration
NonimmigrantsImmigrantsAfghanistanAfricaAlbaniaArgentinaArmeniaAsiaAustraliaAustriaBahamasBangladeshBarbadosBelarusBelgiumBelizeBoliviaBosnia and HerzegovinaBrazilBulgariaBurma/MyanmarCabo VerdeCambodiaCameroonCanadaCaribbeanCentral AmericaChileChinaColombiaCongoCosta RicaCroatiaCubaCzechoslovakiaDenmarkDominicaDominican RepublicEastern AfricaEastern AsiaEastern EuropeEcuadorEgyptEl SalvadorEnglandEritreaEthiopiaEuropeFijiFranceGermanyGhanaGreeceGrenadaGuatemalaGuyanaHaitiHondurasHong KongHungaryIndiaIndonesiaIranIraqIrelandIsraelItalyJamaicaJapanJordanKazakhstanKenyaKoreaKuwaitLaosLatin AmericaLatviaLebanonLiberiaLithuaniaMalaysiaMexicoMicronesiaMiddle AfricaMoldovaMoroccoNepalNetherlandsNicaraguaNigeriaNorth AmericaNorth MacedoniaNorthern AfricaNorthern EuropeNorwayOceaniaPakistanPanamaPeruPhilippinesPolandPortugalRomaniaRussiaSaudi ArabiaScotlandSenegalSerbiaSierra LeoneSingaporeSomaliaSouth AfricaSouth AmericaSouth Central AsiaSouth Eastern AsiaSouthern EuropeSpainSri LankaSt. Vincent and the GrenadinesSudanSwedenSwitzerlandSyriaTaiwanThailandTrinidad and TobagoTurkeyUgandaUkraineUruguayUzbekistanVenezuelaVietnamWest IndiesWestern AfricaWestern AsiaWestern EuropeYemenZaireZimbabweAzores
Potawatomi
Race
Ancestry
AfghanAfricanAlaska NativeAlaskan AthabascanAlbanianAleutAlsatianAmericanApacheArabArapahoArgentineanArmenianAssyrian/Chaldean/SyriacAustralianAustrianBahamianBangladeshiBarbadianBasqueBelgianBelizeanBermudanBhutaneseBlackfeetBolivianBrazilianBritishBritish West IndianBulgarianBurmeseCajunCambodianCanadianCape VerdeanCarpatho RusynCelticCentral AmericanCentral American IndianCherokeeCheyenneChickasawChileanChineseChippewaChoctawColombianColvilleComancheCosta RicanCreeCreekCroatianCrowCubanCypriotCzechCzechoslovakianDanishDelawareDominicanDutchDutch West IndianEastern EuropeanEcuadorianEgyptianEnglishEstonianEthiopianEuropeanFijianFilipinoFinnishFrenchFrench American IndianFrench CanadianGermanGerman RussianGhanaianGreekGuamanian/ChamorroGuatemalanGuyaneseHaitianHmongHonduranHopiHoumaHungarianIcelanderIndian (Asian)IndonesianInupiatIranianIraqiIrishIroquoisIsraeliItalianJamaicanJapaneseJordanianKenyanKiowaKoreanLaotianLatvianLebaneseLiberianLithuanianLumbeeLuxembourgerMacedonianMalaysianMalteseMarshalleseMenomineeMexicanMexican American IndianMongolianMoroccanNative HawaiianNavajoNepaleseNew ZealanderNicaraguanNigerianNorthern EuropeanNorwegianOkinawanOsageOttawaPaiutePakistaniPalestinianPanamanianParaguayanPennsylvania GermanPeruvianPimaPolishPortuguesePotawatomiPuebloPuerto RicanPuget Sound SalishRomanianRussianSalvadoranSamoanScandinavianScotch-IrishScottishSeminoleSenegaleseSerbianShoshoneSierra LeoneanSiouxSlavicSlovakSloveneSomaliSouth AfricanSouth AmericanSouth American IndianSoviet UnionSpaniardSpanishSpanish AmericanSpanish American IndianSri LankanSubsaharan AfricanSudaneseSwedishSwissSyrianTaiwaneseThaiTlingit-HaidaTohono O'OdhamTonganTrinidadian and TobagonianTsimshianTurkishU.S. Virgin IslanderUgandanUkrainianUruguayanUteVenezuelanVietnameseWelshWest IndianYakamaYaquiYugoslavianYumanYup'ikZimbabwean
Immigration
NonimmigrantsImmigrantsAfghanistanAfricaAlbaniaArgentinaArmeniaAsiaAustraliaAustriaBahamasBangladeshBarbadosBelarusBelgiumBelizeBoliviaBosnia and HerzegovinaBrazilBulgariaBurma/MyanmarCabo VerdeCambodiaCameroonCanadaCaribbeanCentral AmericaChileChinaCongoCosta RicaCroatiaCubaCzechoslovakiaDenmarkDominicaDominican RepublicEastern AfricaEastern AsiaEastern EuropeEcuadorEgyptEl SalvadorEnglandEritreaEthiopiaEuropeFijiFranceGermanyGhanaGreeceGrenadaGuatemalaGuyanaHaitiHondurasHong KongHungaryIndiaIndonesiaIranIraqIrelandIsraelItalyJamaicaJapanJordanKazakhstanKenyaKoreaKuwaitLaosLatin AmericaLatviaLebanonLiberiaLithuaniaMalaysiaMexicoMicronesiaMiddle AfricaMoldovaMoroccoNepalNetherlandsNicaraguaNigeriaNorth AmericaNorth MacedoniaNorthern AfricaNorthern EuropeNorwayOceaniaPakistanPanamaPeruPhilippinesPolandPortugalRomaniaRussiaSaudi ArabiaScotlandSenegalSerbiaSierra LeoneSingaporeSomaliaSouth AfricaSouth AmericaSouth Central AsiaSouth Eastern AsiaSouthern EuropeSpainSri LankaSt. Vincent and the GrenadinesSudanSwedenSwitzerlandSyriaTaiwanThailandTrinidad and TobagoTurkeyUgandaUkraineUruguayUzbekistanVenezuelaVietnamWest IndiesWestern AfricaWestern AsiaWestern EuropeYemenZaireZimbabweAzores
In Labor Force | Age 30-34
Income
Poverty
Unemployment
Labor Participation
Family Structure
Vehicle Availability
Education Level
Disability

In Labor Force | Age 30-34 Comparison

Immigrants from Colombia

Potawatomi

Good
Tragic
84.9%
IN LABOR FORCE | AGE 30-34
76.3/ 100
METRIC RATING
147th/ 347
METRIC RANK
82.8%
IN LABOR FORCE | AGE 30-34
0.0/ 100
METRIC RATING
291st/ 347
METRIC RANK

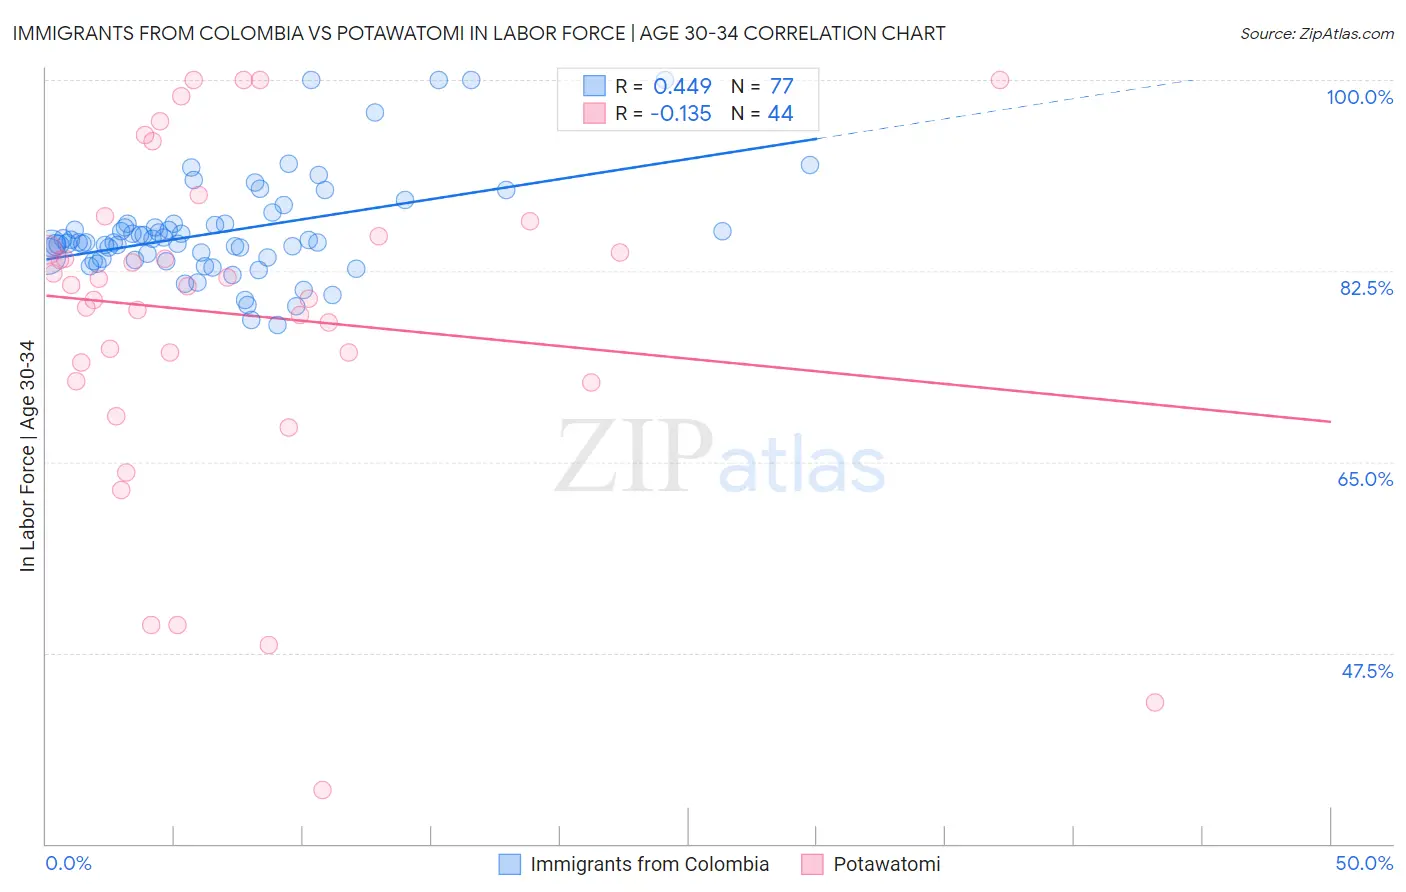
Immigrants from Colombia vs Potawatomi In Labor Force | Age 30-34 Correlation Chart

The statistical analysis conducted on geographies consisting of 378,496,738 people shows a moderate positive correlation between the proportion of Immigrants from Colombia and labor force participation rate among population between the ages 30 and 34 in the United States with a correlation coefficient (R) of 0.449 and weighted average of 84.9%. Similarly, the statistical analysis conducted on geographies consisting of 117,760,740 people shows a poor negative correlation between the proportion of Potawatomi and labor force participation rate among population between the ages 30 and 34 in the United States with a correlation coefficient (R) of -0.135 and weighted average of 82.8%, a difference of 2.5%.
Immigrants from Colombia vs Potawatomi In Labor Force | Age 30-34

In Labor Force | Age 30-34 Correlation Summary

MeasurementImmigrants from ColombiaPotawatomi
Minimum77.6%34.9%
Maximum100.0%100.0%
Range22.4%65.1%
Mean86.1%78.5%
Median85.1%81.2%
Interquartile 25% (IQ1)83.6%73.3%
Interquartile 75% (IQ3)86.8%86.4%
Interquartile Range (IQR)3.2%13.1%
Standard Deviation (Sample)4.7%15.3%
Standard Deviation (Population)4.6%15.2%

Similar Demographics by In Labor Force | Age 30-34

Demographics Similar to Immigrants from Colombia by In Labor Force | Age 30-34

In terms of in labor force | age 30-34, the demographic groups most similar to Immigrants from Colombia are Immigrants from Saudi Arabia (84.9%, a difference of 0.0%), Immigrants from Pakistan (84.9%, a difference of 0.0%), Palestinian (84.9%, a difference of 0.010%), Immigrants from Ukraine (84.8%, a difference of 0.010%), and German (84.8%, a difference of 0.010%).
DemographicsRating | RankIn Labor Force | Age 30-34
Immigrants | Vietnam
86.5
/100
|
#140
Excellent
85.0%
Chileans
85.3
/100
|
#141
Excellent
84.9%
Immigrants | Indonesia
84.3
/100
|
#142
Excellent
84.9%
Colombians
82.2
/100
|
#143
Excellent
84.9%
Uruguayans
78.5
/100
|
#144
Good
84.9%
Palestinians
77.7
/100
|
#145
Good
84.9%
Immigrants | Saudi Arabia
76.6
/100
|
#146
Good
84.9%
Immigrants | Colombia
76.3
/100
|
#147
Good
84.9%
Immigrants | Pakistan
76.2
/100
|
#148
Good
84.9%
Immigrants | Ukraine
75.1
/100
|
#149
Good
84.8%
Germans
75.1
/100
|
#150
Good
84.8%
Immigrants | Senegal
74.0
/100
|
#151
Good
84.8%
Romanians
73.5
/100
|
#152
Good
84.8%
Syrians
70.1
/100
|
#153
Good
84.8%
Northern Europeans
70.0
/100
|
#154
Good
84.8%

Demographics Similar to Potawatomi by In Labor Force | Age 30-34

In terms of in labor force | age 30-34, the demographic groups most similar to Potawatomi are Blackfeet (82.8%, a difference of 0.020%), Black/African American (82.8%, a difference of 0.020%), Nepalese (82.7%, a difference of 0.080%), American (82.7%, a difference of 0.11%), and Pennsylvania German (82.6%, a difference of 0.23%).
DemographicsRating | RankIn Labor Force | Age 30-34
Immigrants | Belize
0.0
/100
|
#284
Tragic
83.2%
Cree
0.0
/100
|
#285
Tragic
83.2%
Immigrants | Latin America
0.0
/100
|
#286
Tragic
83.1%
Native Hawaiians
0.0
/100
|
#287
Tragic
83.0%
Central American Indians
0.0
/100
|
#288
Tragic
83.0%
Hawaiians
0.0
/100
|
#289
Tragic
83.0%
Blackfeet
0.0
/100
|
#290
Tragic
82.8%
Potawatomi
0.0
/100
|
#291
Tragic
82.8%
Blacks/African Americans
0.0
/100
|
#292
Tragic
82.8%
Nepalese
0.0
/100
|
#293
Tragic
82.7%
Americans
0.0
/100
|
#294
Tragic
82.7%
Pennsylvania Germans
0.0
/100
|
#295
Tragic
82.6%
Chippewa
0.0
/100
|
#296
Tragic
82.6%
Comanche
0.0
/100
|
#297
Tragic
82.6%
Aleuts
0.0
/100
|
#298
Tragic
82.6%