Immigrants from Caribbean vs Alaska Native In Labor Force | Age 30-34

COMPARE

Immigrants from Caribbean
Race
Ancestry
AfghanAfricanAlaskan AthabascanAlbanianAleutAlsatianAmericanApacheArabArapahoArgentineanArmenianAssyrian/Chaldean/SyriacAustralianAustrianBahamianBangladeshiBarbadianBasqueBelgianBelizeanBermudanBhutaneseBlackfeetBolivianBrazilianBritishBritish West IndianBulgarianBurmeseCajunCambodianCanadianCape VerdeanCarpatho RusynCelticCentral AmericanCentral American IndianCherokeeCheyenneChickasawChileanChineseChippewaChoctawColombianColvilleComancheCosta RicanCreeCreekCroatianCrowCubanCypriotCzechCzechoslovakianDanishDelawareDominicanDutchDutch West IndianEastern EuropeanEcuadorianEgyptianEnglishEstonianEthiopianEuropeanFijianFilipinoFinnishFrenchFrench American IndianFrench CanadianGermanGerman RussianGhanaianGreekGuamanian/ChamorroGuatemalanGuyaneseHaitianHmongHonduranHopiHoumaHungarianIcelanderIndian (Asian)IndonesianInupiatIranianIraqiIrishIroquoisIsraeliItalianJamaicanJapaneseJordanianKenyanKiowaKoreanLaotianLatvianLebaneseLiberianLithuanianLumbeeLuxembourgerMacedonianMalaysianMalteseMarshalleseMenomineeMexicanMexican American IndianMongolianMoroccanNative HawaiianNavajoNepaleseNew ZealanderNicaraguanNigerianNorthern EuropeanNorwegianOkinawanOsageOttawaPaiutePakistaniPalestinianPanamanianParaguayanPennsylvania GermanPeruvianPimaPolishPortuguesePotawatomiPuebloPuerto RicanPuget Sound SalishRomanianRussianSalvadoranSamoanScandinavianScotch-IrishScottishSeminoleSenegaleseSerbianShoshoneSierra LeoneanSiouxSlavicSlovakSloveneSomaliSouth AfricanSouth AmericanSouth American IndianSoviet UnionSpaniardSpanishSpanish AmericanSpanish American IndianSri LankanSubsaharan AfricanSudaneseSwedishSwissSyrianTaiwaneseThaiTlingit-HaidaTohono O'OdhamTonganTrinidadian and TobagonianTsimshianTurkishU.S. Virgin IslanderUgandanUkrainianUruguayanUteVenezuelanVietnameseWelshWest IndianYakamaYaquiYugoslavianYumanYup'ikZimbabwean
Immigration
NonimmigrantsImmigrantsAfghanistanAfricaAlbaniaArgentinaArmeniaAsiaAustraliaAustriaBahamasBangladeshBarbadosBelarusBelgiumBelizeBoliviaBosnia and HerzegovinaBrazilBulgariaBurma/MyanmarCabo VerdeCambodiaCameroonCanadaCaribbeanCentral AmericaChileChinaColombiaCongoCosta RicaCroatiaCubaCzechoslovakiaDenmarkDominicaDominican RepublicEastern AfricaEastern AsiaEastern EuropeEcuadorEgyptEl SalvadorEnglandEritreaEthiopiaEuropeFijiFranceGermanyGhanaGreeceGrenadaGuatemalaGuyanaHaitiHondurasHong KongHungaryIndiaIndonesiaIranIraqIrelandIsraelItalyJamaicaJapanJordanKazakhstanKenyaKoreaKuwaitLaosLatin AmericaLatviaLebanonLiberiaLithuaniaMalaysiaMexicoMicronesiaMiddle AfricaMoldovaMoroccoNepalNetherlandsNicaraguaNigeriaNorth AmericaNorth MacedoniaNorthern AfricaNorthern EuropeNorwayOceaniaPakistanPanamaPeruPhilippinesPolandPortugalRomaniaRussiaSaudi ArabiaScotlandSenegalSerbiaSierra LeoneSingaporeSomaliaSouth AfricaSouth AmericaSouth Central AsiaSouth Eastern AsiaSouthern EuropeSpainSri LankaSt. Vincent and the GrenadinesSudanSwedenSwitzerlandSyriaTaiwanThailandTrinidad and TobagoTurkeyUgandaUkraineUruguayUzbekistanVenezuelaVietnamWest IndiesWestern AfricaWestern AsiaWestern EuropeYemenZaireZimbabweAzores
Alaska Native
Race
Ancestry
AfghanAfricanAlaska NativeAlaskan AthabascanAlbanianAleutAlsatianAmericanApacheArabArapahoArgentineanArmenianAssyrian/Chaldean/SyriacAustralianAustrianBahamianBangladeshiBarbadianBasqueBelgianBelizeanBermudanBhutaneseBlackfeetBolivianBrazilianBritishBritish West IndianBulgarianBurmeseCajunCambodianCanadianCape VerdeanCarpatho RusynCelticCentral AmericanCentral American IndianCherokeeCheyenneChickasawChileanChineseChippewaChoctawColombianColvilleComancheCosta RicanCreeCreekCroatianCrowCubanCypriotCzechCzechoslovakianDanishDelawareDominicanDutchDutch West IndianEastern EuropeanEcuadorianEgyptianEnglishEstonianEthiopianEuropeanFijianFilipinoFinnishFrenchFrench American IndianFrench CanadianGermanGerman RussianGhanaianGreekGuamanian/ChamorroGuatemalanGuyaneseHaitianHmongHonduranHopiHoumaHungarianIcelanderIndian (Asian)IndonesianInupiatIranianIraqiIrishIroquoisIsraeliItalianJamaicanJapaneseJordanianKenyanKiowaKoreanLaotianLatvianLebaneseLiberianLithuanianLumbeeLuxembourgerMacedonianMalaysianMalteseMarshalleseMenomineeMexicanMexican American IndianMongolianMoroccanNative HawaiianNavajoNepaleseNew ZealanderNicaraguanNigerianNorthern EuropeanNorwegianOkinawanOsageOttawaPaiutePakistaniPalestinianPanamanianParaguayanPennsylvania GermanPeruvianPimaPolishPortuguesePotawatomiPuebloPuerto RicanPuget Sound SalishRomanianRussianSalvadoranSamoanScandinavianScotch-IrishScottishSeminoleSenegaleseSerbianShoshoneSierra LeoneanSiouxSlavicSlovakSloveneSomaliSouth AfricanSouth AmericanSouth American IndianSoviet UnionSpaniardSpanishSpanish AmericanSpanish American IndianSri LankanSubsaharan AfricanSudaneseSwedishSwissSyrianTaiwaneseThaiTlingit-HaidaTohono O'OdhamTonganTrinidadian and TobagonianTsimshianTurkishU.S. Virgin IslanderUgandanUkrainianUruguayanUteVenezuelanVietnameseWelshWest IndianYakamaYaquiYugoslavianYumanYup'ikZimbabwean
Immigration
NonimmigrantsImmigrantsAfghanistanAfricaAlbaniaArgentinaArmeniaAsiaAustraliaAustriaBahamasBangladeshBarbadosBelarusBelgiumBelizeBoliviaBosnia and HerzegovinaBrazilBulgariaBurma/MyanmarCabo VerdeCambodiaCameroonCanadaCentral AmericaChileChinaColombiaCongoCosta RicaCroatiaCubaCzechoslovakiaDenmarkDominicaDominican RepublicEastern AfricaEastern AsiaEastern EuropeEcuadorEgyptEl SalvadorEnglandEritreaEthiopiaEuropeFijiFranceGermanyGhanaGreeceGrenadaGuatemalaGuyanaHaitiHondurasHong KongHungaryIndiaIndonesiaIranIraqIrelandIsraelItalyJamaicaJapanJordanKazakhstanKenyaKoreaKuwaitLaosLatin AmericaLatviaLebanonLiberiaLithuaniaMalaysiaMexicoMicronesiaMiddle AfricaMoldovaMoroccoNepalNetherlandsNicaraguaNigeriaNorth AmericaNorth MacedoniaNorthern AfricaNorthern EuropeNorwayOceaniaPakistanPanamaPeruPhilippinesPolandPortugalRomaniaRussiaSaudi ArabiaScotlandSenegalSerbiaSierra LeoneSingaporeSomaliaSouth AfricaSouth AmericaSouth Central AsiaSouth Eastern AsiaSouthern EuropeSpainSri LankaSt. Vincent and the GrenadinesSudanSwedenSwitzerlandSyriaTaiwanThailandTrinidad and TobagoTurkeyUgandaUkraineUruguayUzbekistanVenezuelaVietnamWest IndiesWestern AfricaWestern AsiaWestern EuropeYemenZaireZimbabweAzores
In Labor Force | Age 30-34
Income
Poverty
Unemployment
Labor Participation
Family Structure
Vehicle Availability
Education Level
Disability

In Labor Force | Age 30-34 Comparison

Immigrants from Caribbean

Alaska Natives

Tragic
Tragic
84.0%
IN LABOR FORCE | AGE 30-34
1.1/ 100
METRIC RATING
243rd/ 347
METRIC RANK
81.3%
IN LABOR FORCE | AGE 30-34
0.0/ 100
METRIC RATING
321st/ 347
METRIC RANK

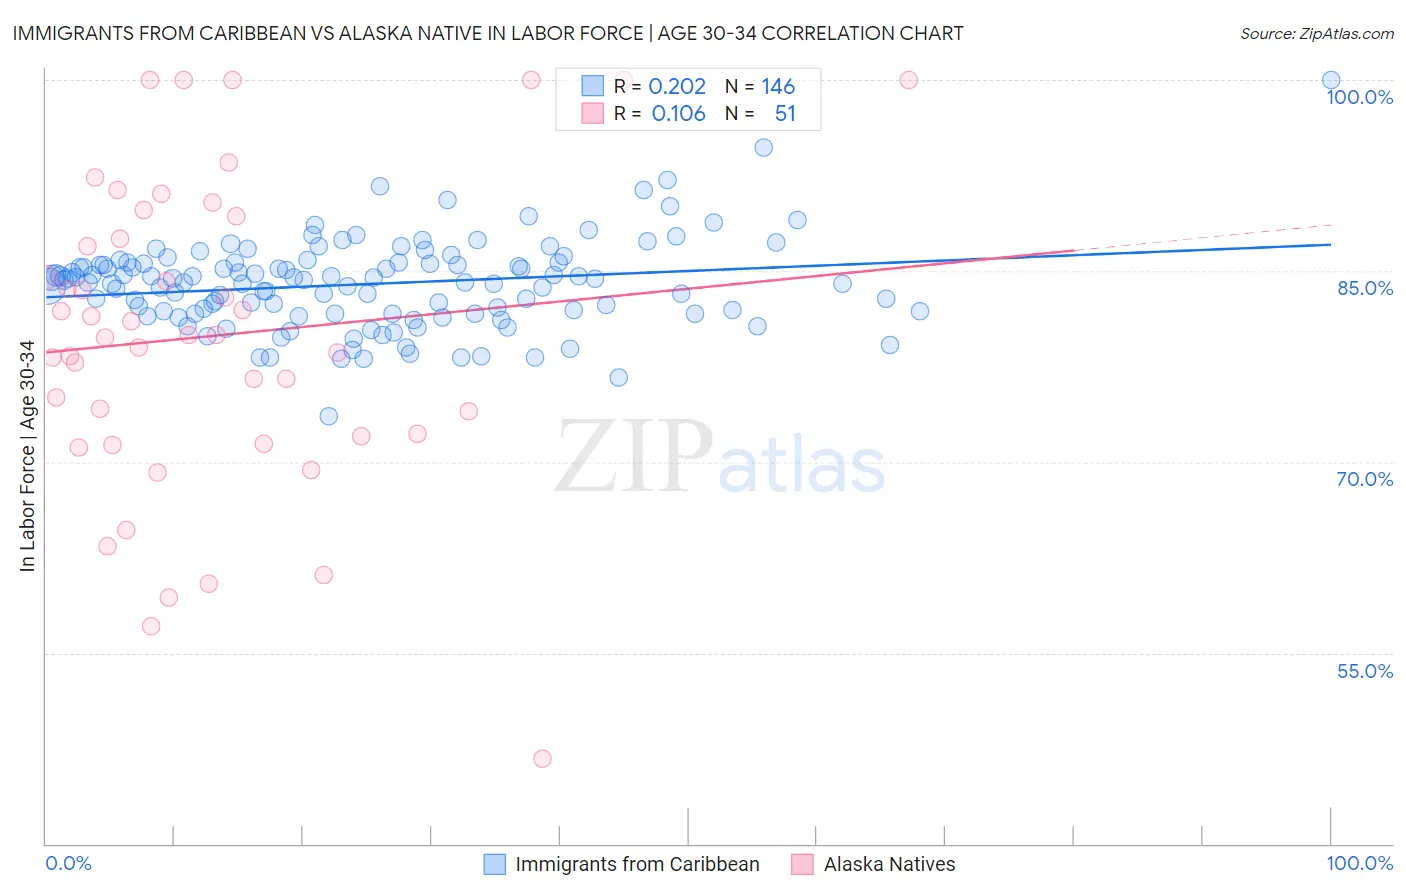
Immigrants from Caribbean vs Alaska Native In Labor Force | Age 30-34 Correlation Chart

The statistical analysis conducted on geographies consisting of 449,684,451 people shows a weak positive correlation between the proportion of Immigrants from Caribbean and labor force participation rate among population between the ages 30 and 34 in the United States with a correlation coefficient (R) of 0.202 and weighted average of 84.0%. Similarly, the statistical analysis conducted on geographies consisting of 76,755,114 people shows a poor positive correlation between the proportion of Alaska Natives and labor force participation rate among population between the ages 30 and 34 in the United States with a correlation coefficient (R) of 0.106 and weighted average of 81.3%, a difference of 3.3%.
Immigrants from Caribbean vs Alaska Native In Labor Force | Age 30-34

In Labor Force | Age 30-34 Correlation Summary

MeasurementImmigrants from CaribbeanAlaska Native
Minimum73.6%46.7%
Maximum100.0%100.0%
Range26.4%53.3%
Mean84.0%79.9%
Median84.2%80.0%
Interquartile 25% (IQ1)81.6%72.0%
Interquartile 75% (IQ3)85.6%89.3%
Interquartile Range (IQR)4.0%17.3%
Standard Deviation (Sample)3.5%12.2%
Standard Deviation (Population)3.5%12.1%

Similar Demographics by In Labor Force | Age 30-34

Demographics Similar to Immigrants from Caribbean by In Labor Force | Age 30-34

In terms of in labor force | age 30-34, the demographic groups most similar to Immigrants from Caribbean are Immigrants from Oceania (84.0%, a difference of 0.010%), Immigrants from Portugal (84.0%, a difference of 0.020%), Basque (84.0%, a difference of 0.030%), Immigrants from Venezuela (84.0%, a difference of 0.030%), and Central American (84.0%, a difference of 0.030%).
DemographicsRating | RankIn Labor Force | Age 30-34
U.S. Virgin Islanders
1.5
/100
|
#236
Tragic
84.1%
Celtics
1.4
/100
|
#237
Tragic
84.1%
Immigrants | Barbados
1.4
/100
|
#238
Tragic
84.0%
English
1.4
/100
|
#239
Tragic
84.0%
Venezuelans
1.3
/100
|
#240
Tragic
84.0%
Immigrants | Portugal
1.2
/100
|
#241
Tragic
84.0%
Immigrants | Oceania
1.1
/100
|
#242
Tragic
84.0%
Immigrants | Caribbean
1.1
/100
|
#243
Tragic
84.0%
Basques
0.9
/100
|
#244
Tragic
84.0%
Immigrants | Venezuela
0.9
/100
|
#245
Tragic
84.0%
Central Americans
0.9
/100
|
#246
Tragic
84.0%
British West Indians
0.8
/100
|
#247
Tragic
84.0%
Portuguese
0.8
/100
|
#248
Tragic
84.0%
Immigrants | Dominica
0.7
/100
|
#249
Tragic
84.0%
Immigrants | Iraq
0.7
/100
|
#250
Tragic
83.9%

Demographics Similar to Alaska Natives by In Labor Force | Age 30-34

In terms of in labor force | age 30-34, the demographic groups most similar to Alaska Natives are Yaqui (81.4%, a difference of 0.080%), Choctaw (81.4%, a difference of 0.10%), Shoshone (81.4%, a difference of 0.10%), Puerto Rican (81.2%, a difference of 0.16%), and Immigrants from the Azores (81.5%, a difference of 0.18%).
DemographicsRating | RankIn Labor Force | Age 30-34
Alaskan Athabascans
0.0
/100
|
#314
Tragic
81.7%
Cherokee
0.0
/100
|
#315
Tragic
81.6%
Immigrants | Azores
0.0
/100
|
#316
Tragic
81.5%
Arapaho
0.0
/100
|
#317
Tragic
81.5%
Choctaw
0.0
/100
|
#318
Tragic
81.4%
Shoshone
0.0
/100
|
#319
Tragic
81.4%
Yaqui
0.0
/100
|
#320
Tragic
81.4%
Alaska Natives
0.0
/100
|
#321
Tragic
81.3%
Puerto Ricans
0.0
/100
|
#322
Tragic
81.2%
Paiute
0.0
/100
|
#323
Tragic
81.2%
Cheyenne
0.0
/100
|
#324
Tragic
81.1%
Dutch West Indians
0.0
/100
|
#325
Tragic
81.0%
Seminole
0.0
/100
|
#326
Tragic
80.8%
Colville
0.0
/100
|
#327
Tragic
80.7%
Sioux
0.0
/100
|
#328
Tragic
80.4%