Immigrants from Canada vs Iranian In Labor Force | Age 45-54

COMPARE

Immigrants from Canada
Race
Ancestry
AfghanAfricanAlaska NativeAlaskan AthabascanAlbanianAleutAlsatianAmericanApacheArabArapahoArgentineanArmenianAssyrian/Chaldean/SyriacAustralianAustrianBahamianBangladeshiBarbadianBasqueBelgianBelizeanBermudanBhutaneseBlackfeetBolivianBrazilianBritishBritish West IndianBulgarianBurmeseCajunCambodianCanadianCape VerdeanCarpatho RusynCelticCentral AmericanCentral American IndianCherokeeCheyenneChickasawChileanChineseChippewaChoctawColombianColvilleComancheCosta RicanCreeCreekCroatianCrowCubanCypriotCzechCzechoslovakianDanishDelawareDominicanDutchDutch West IndianEastern EuropeanEcuadorianEgyptianEnglishEstonianEthiopianEuropeanFijianFilipinoFinnishFrenchFrench American IndianFrench CanadianGermanGerman RussianGhanaianGreekGuamanian/ChamorroGuatemalanGuyaneseHaitianHmongHonduranHopiHoumaHungarianIcelanderIndian (Asian)IndonesianInupiatIraqiIrishIroquoisIsraeliItalianJamaicanJapaneseJordanianKenyanKiowaKoreanLaotianLatvianLebaneseLiberianLithuanianLumbeeLuxembourgerMacedonianMalaysianMalteseMarshalleseMenomineeMexicanMexican American IndianMongolianMoroccanNative HawaiianNavajoNepaleseNew ZealanderNicaraguanNigerianNorthern EuropeanNorwegianOkinawanOsageOttawaPaiutePakistaniPalestinianPanamanianParaguayanPennsylvania GermanPeruvianPimaPolishPortuguesePotawatomiPuebloPuerto RicanPuget Sound SalishRomanianRussianSalvadoranSamoanScandinavianScotch-IrishScottishSeminoleSenegaleseSerbianShoshoneSierra LeoneanSiouxSlavicSlovakSloveneSomaliSouth AfricanSouth AmericanSouth American IndianSoviet UnionSpaniardSpanishSpanish AmericanSpanish American IndianSri LankanSubsaharan AfricanSudaneseSwedishSwissSyrianTaiwaneseThaiTlingit-HaidaTohono O'OdhamTonganTrinidadian and TobagonianTsimshianTurkishU.S. Virgin IslanderUgandanUkrainianUruguayanUteVenezuelanVietnameseWelshWest IndianYakamaYaquiYugoslavianYumanYup'ikZimbabwean
Immigration
NonimmigrantsImmigrantsAfghanistanAfricaAlbaniaArgentinaArmeniaAsiaAustraliaAustriaBahamasBangladeshBarbadosBelarusBelgiumBelizeBoliviaBosnia and HerzegovinaBrazilBulgariaBurma/MyanmarCabo VerdeCambodiaCameroonCanadaCaribbeanCentral AmericaChileChinaColombiaCongoCosta RicaCroatiaCubaCzechoslovakiaDenmarkDominicaDominican RepublicEastern AfricaEastern AsiaEastern EuropeEcuadorEgyptEl SalvadorEnglandEritreaEthiopiaEuropeFijiFranceGermanyGhanaGreeceGrenadaGuatemalaGuyanaHaitiHondurasHong KongHungaryIndiaIndonesiaIranIraqIrelandIsraelItalyJamaicaJapanJordanKazakhstanKenyaKoreaKuwaitLaosLatin AmericaLatviaLebanonLiberiaLithuaniaMalaysiaMexicoMicronesiaMiddle AfricaMoldovaMoroccoNepalNetherlandsNicaraguaNigeriaNorth AmericaNorth MacedoniaNorthern AfricaNorthern EuropeNorwayOceaniaPakistanPanamaPeruPhilippinesPolandPortugalRomaniaRussiaSaudi ArabiaScotlandSenegalSerbiaSierra LeoneSingaporeSomaliaSouth AfricaSouth AmericaSouth Central AsiaSouth Eastern AsiaSouthern EuropeSpainSri LankaSt. Vincent and the GrenadinesSudanSwedenSwitzerlandSyriaTaiwanThailandTrinidad and TobagoTurkeyUgandaUkraineUruguayUzbekistanVenezuelaVietnamWest IndiesWestern AfricaWestern AsiaWestern EuropeYemenZaireZimbabweAzores
Iranian
Race
Ancestry
AfghanAfricanAlaska NativeAlaskan AthabascanAlbanianAleutAlsatianAmericanApacheArabArapahoArgentineanArmenianAssyrian/Chaldean/SyriacAustralianAustrianBahamianBangladeshiBarbadianBasqueBelgianBelizeanBermudanBhutaneseBlackfeetBolivianBrazilianBritishBritish West IndianBulgarianBurmeseCajunCambodianCanadianCape VerdeanCarpatho RusynCelticCentral AmericanCentral American IndianCherokeeCheyenneChickasawChileanChineseChippewaChoctawColombianColvilleComancheCosta RicanCreeCreekCroatianCrowCubanCypriotCzechCzechoslovakianDanishDelawareDominicanDutchDutch West IndianEastern EuropeanEcuadorianEgyptianEnglishEstonianEthiopianEuropeanFijianFilipinoFinnishFrenchFrench American IndianFrench CanadianGermanGerman RussianGhanaianGreekGuamanian/ChamorroGuatemalanGuyaneseHaitianHmongHonduranHopiHoumaHungarianIcelanderIndian (Asian)IndonesianInupiatIranianIraqiIrishIroquoisIsraeliItalianJamaicanJapaneseJordanianKenyanKiowaKoreanLaotianLatvianLebaneseLiberianLithuanianLumbeeLuxembourgerMacedonianMalaysianMalteseMarshalleseMenomineeMexicanMexican American IndianMongolianMoroccanNative HawaiianNavajoNepaleseNew ZealanderNicaraguanNigerianNorthern EuropeanNorwegianOkinawanOsageOttawaPaiutePakistaniPalestinianPanamanianParaguayanPennsylvania GermanPeruvianPimaPolishPortuguesePotawatomiPuebloPuerto RicanPuget Sound SalishRomanianRussianSalvadoranSamoanScandinavianScotch-IrishScottishSeminoleSenegaleseSerbianShoshoneSierra LeoneanSiouxSlavicSlovakSloveneSomaliSouth AfricanSouth AmericanSouth American IndianSoviet UnionSpaniardSpanishSpanish AmericanSpanish American IndianSri LankanSubsaharan AfricanSudaneseSwedishSwissSyrianTaiwaneseThaiTlingit-HaidaTohono O'OdhamTonganTrinidadian and TobagonianTsimshianTurkishU.S. Virgin IslanderUgandanUkrainianUruguayanUteVenezuelanVietnameseWelshWest IndianYakamaYaquiYugoslavianYumanYup'ikZimbabwean
Immigration
NonimmigrantsImmigrantsAfghanistanAfricaAlbaniaArgentinaArmeniaAsiaAustraliaAustriaBahamasBangladeshBarbadosBelarusBelgiumBelizeBoliviaBosnia and HerzegovinaBrazilBulgariaBurma/MyanmarCabo VerdeCambodiaCameroonCaribbeanCentral AmericaChileChinaColombiaCongoCosta RicaCroatiaCubaCzechoslovakiaDenmarkDominicaDominican RepublicEastern AfricaEastern AsiaEastern EuropeEcuadorEgyptEl SalvadorEnglandEritreaEthiopiaEuropeFijiFranceGermanyGhanaGreeceGrenadaGuatemalaGuyanaHaitiHondurasHong KongHungaryIndiaIndonesiaIranIraqIrelandIsraelItalyJamaicaJapanJordanKazakhstanKenyaKoreaKuwaitLaosLatin AmericaLatviaLebanonLiberiaLithuaniaMalaysiaMexicoMicronesiaMiddle AfricaMoldovaMoroccoNepalNetherlandsNicaraguaNigeriaNorth AmericaNorth MacedoniaNorthern AfricaNorthern EuropeNorwayOceaniaPakistanPanamaPeruPhilippinesPolandPortugalRomaniaRussiaSaudi ArabiaScotlandSenegalSerbiaSierra LeoneSingaporeSomaliaSouth AfricaSouth AmericaSouth Central AsiaSouth Eastern AsiaSouthern EuropeSpainSri LankaSt. Vincent and the GrenadinesSudanSwedenSwitzerlandSyriaTaiwanThailandTrinidad and TobagoTurkeyUgandaUkraineUruguayUzbekistanVenezuelaVietnamWest IndiesWestern AfricaWestern AsiaWestern EuropeYemenZaireZimbabweAzores
In Labor Force | Age 45-54
Income
Poverty
Unemployment
Labor Participation
Family Structure
Vehicle Availability
Education Level
Disability

In Labor Force | Age 45-54 Comparison

Immigrants from Canada

Iranians

Fair
Exceptional
82.5%
IN LABOR FORCE | AGE 45-54
20.0/ 100
METRIC RATING
195th/ 347
METRIC RANK
83.2%
IN LABOR FORCE | AGE 45-54
92.9/ 100
METRIC RATING
107th/ 347
METRIC RANK

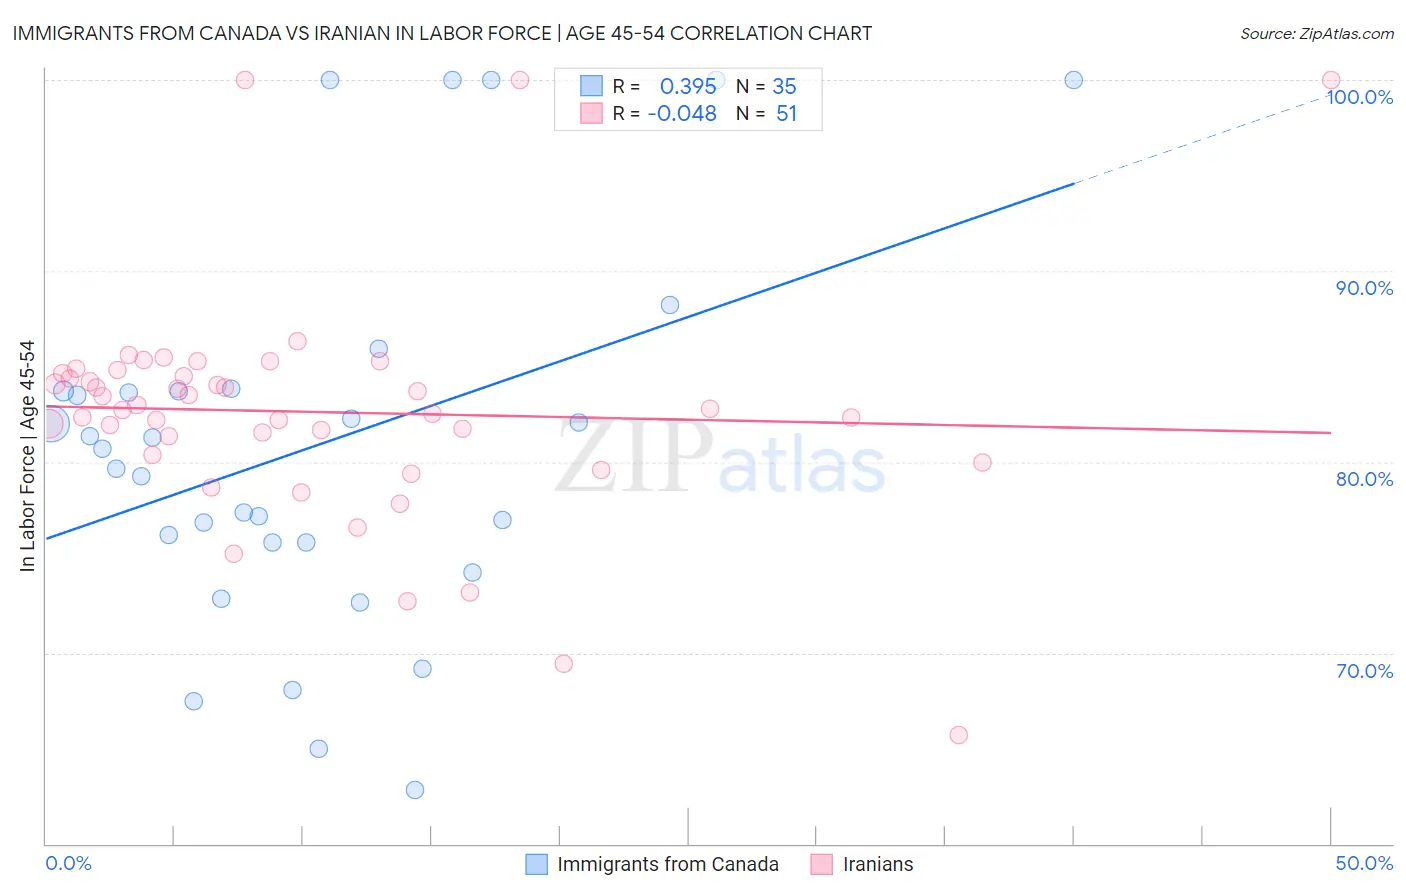
Immigrants from Canada vs Iranian In Labor Force | Age 45-54 Correlation Chart

The statistical analysis conducted on geographies consisting of 459,096,447 people shows a mild positive correlation between the proportion of Immigrants from Canada and labor force participation rate among population between the ages 45 and 54 in the United States with a correlation coefficient (R) of 0.395 and weighted average of 82.5%. Similarly, the statistical analysis conducted on geographies consisting of 316,652,476 people shows no correlation between the proportion of Iranians and labor force participation rate among population between the ages 45 and 54 in the United States with a correlation coefficient (R) of -0.048 and weighted average of 83.2%, a difference of 0.87%.
Immigrants from Canada vs Iranian In Labor Force | Age 45-54

In Labor Force | Age 45-54 Correlation Summary

MeasurementImmigrants from CanadaIranian
Minimum62.8%65.7%
Maximum100.0%100.0%
Range37.2%34.3%
Mean80.8%82.6%
Median80.7%82.8%
Interquartile 25% (IQ1)75.8%80.4%
Interquartile 75% (IQ3)83.7%84.6%
Interquartile Range (IQR)8.0%4.3%
Standard Deviation (Sample)9.9%6.1%
Standard Deviation (Population)9.7%6.0%

Similar Demographics by In Labor Force | Age 45-54

Demographics Similar to Immigrants from Canada by In Labor Force | Age 45-54

In terms of in labor force | age 45-54, the demographic groups most similar to Immigrants from Canada are Immigrants from Iraq (82.5%, a difference of 0.010%), Australian (82.5%, a difference of 0.010%), Immigrants from Norway (82.5%, a difference of 0.010%), Immigrants from North America (82.5%, a difference of 0.020%), and Lebanese (82.5%, a difference of 0.030%).
DemographicsRating | RankIn Labor Force | Age 45-54
South Africans
28.0
/100
|
#188
Fair
82.6%
Syrians
26.0
/100
|
#189
Fair
82.6%
British
25.7
/100
|
#190
Fair
82.6%
Armenians
23.2
/100
|
#191
Fair
82.5%
Immigrants | Iraq
20.9
/100
|
#192
Fair
82.5%
Australians
20.8
/100
|
#193
Fair
82.5%
Immigrants | Norway
20.7
/100
|
#194
Fair
82.5%
Immigrants | Canada
20.0
/100
|
#195
Fair
82.5%
Immigrants | North America
18.8
/100
|
#196
Poor
82.5%
Lebanese
18.2
/100
|
#197
Poor
82.5%
Immigrants | Denmark
17.9
/100
|
#198
Poor
82.5%
Moroccans
15.7
/100
|
#199
Poor
82.5%
French Canadians
15.4
/100
|
#200
Poor
82.5%
Canadians
15.1
/100
|
#201
Poor
82.4%
Immigrants | Western Asia
14.9
/100
|
#202
Poor
82.4%

Demographics Similar to Iranians by In Labor Force | Age 45-54

In terms of in labor force | age 45-54, the demographic groups most similar to Iranians are Slovak (83.2%, a difference of 0.0%), Sri Lankan (83.2%, a difference of 0.010%), Ukrainian (83.2%, a difference of 0.010%), Immigrants from Africa (83.2%, a difference of 0.010%), and Immigrants from Italy (83.2%, a difference of 0.010%).
DemographicsRating | RankIn Labor Force | Age 45-54
Mongolians
94.2
/100
|
#100
Exceptional
83.3%
Immigrants | Belarus
94.1
/100
|
#101
Exceptional
83.3%
Immigrants | Singapore
93.9
/100
|
#102
Exceptional
83.3%
Albanians
93.9
/100
|
#103
Exceptional
83.3%
Immigrants | Romania
93.8
/100
|
#104
Exceptional
83.3%
Immigrants | South America
93.5
/100
|
#105
Exceptional
83.2%
Sri Lankans
93.2
/100
|
#106
Exceptional
83.2%
Iranians
92.9
/100
|
#107
Exceptional
83.2%
Slovaks
92.8
/100
|
#108
Exceptional
83.2%
Ukrainians
92.7
/100
|
#109
Exceptional
83.2%
Immigrants | Africa
92.6
/100
|
#110
Exceptional
83.2%
Immigrants | Italy
92.5
/100
|
#111
Exceptional
83.2%
Immigrants | Afghanistan
92.4
/100
|
#112
Exceptional
83.2%
Immigrants | Albania
91.8
/100
|
#113
Exceptional
83.2%
Assyrians/Chaldeans/Syriacs
91.7
/100
|
#114
Exceptional
83.2%