Immigrants from Cabo Verde vs Immigrants from Taiwan In Labor Force | Age 30-34

COMPARE

Immigrants from Cabo Verde
Race
Ancestry
AfghanAfricanAlaska NativeAlaskan AthabascanAlbanianAleutAlsatianAmericanApacheArabArapahoArgentineanArmenianAssyrian/Chaldean/SyriacAustralianAustrianBahamianBangladeshiBarbadianBasqueBelgianBelizeanBermudanBhutaneseBlackfeetBolivianBrazilianBritishBritish West IndianBulgarianBurmeseCajunCambodianCanadianCape VerdeanCarpatho RusynCelticCentral AmericanCentral American IndianCherokeeCheyenneChickasawChileanChineseChippewaChoctawColombianColvilleComancheCosta RicanCreeCreekCroatianCrowCubanCypriotCzechCzechoslovakianDanishDelawareDominicanDutchDutch West IndianEastern EuropeanEcuadorianEgyptianEnglishEstonianEthiopianEuropeanFijianFilipinoFinnishFrenchFrench American IndianFrench CanadianGermanGerman RussianGhanaianGreekGuamanian/ChamorroGuatemalanGuyaneseHaitianHmongHonduranHopiHoumaHungarianIcelanderIndian (Asian)IndonesianInupiatIranianIraqiIrishIroquoisIsraeliItalianJamaicanJapaneseJordanianKenyanKiowaKoreanLaotianLatvianLebaneseLiberianLithuanianLumbeeLuxembourgerMacedonianMalaysianMalteseMarshalleseMenomineeMexicanMexican American IndianMongolianMoroccanNative HawaiianNavajoNepaleseNew ZealanderNicaraguanNigerianNorthern EuropeanNorwegianOkinawanOsageOttawaPaiutePakistaniPalestinianPanamanianParaguayanPennsylvania GermanPeruvianPimaPolishPortuguesePotawatomiPuebloPuerto RicanPuget Sound SalishRomanianRussianSalvadoranSamoanScandinavianScotch-IrishScottishSeminoleSenegaleseSerbianShoshoneSierra LeoneanSiouxSlavicSlovakSloveneSomaliSouth AfricanSouth AmericanSouth American IndianSoviet UnionSpaniardSpanishSpanish AmericanSpanish American IndianSri LankanSubsaharan AfricanSudaneseSwedishSwissSyrianTaiwaneseThaiTlingit-HaidaTohono O'OdhamTonganTrinidadian and TobagonianTsimshianTurkishU.S. Virgin IslanderUgandanUkrainianUruguayanUteVenezuelanVietnameseWelshWest IndianYakamaYaquiYugoslavianYumanYup'ikZimbabwean
Immigration
NonimmigrantsImmigrantsAfghanistanAfricaAlbaniaArgentinaArmeniaAsiaAustraliaAustriaBahamasBangladeshBarbadosBelarusBelgiumBelizeBoliviaBosnia and HerzegovinaBrazilBulgariaBurma/MyanmarCabo VerdeCambodiaCameroonCanadaCaribbeanCentral AmericaChileChinaColombiaCongoCosta RicaCroatiaCubaCzechoslovakiaDenmarkDominicaDominican RepublicEastern AfricaEastern AsiaEastern EuropeEcuadorEgyptEl SalvadorEnglandEritreaEthiopiaEuropeFijiFranceGermanyGhanaGreeceGrenadaGuatemalaGuyanaHaitiHondurasHong KongHungaryIndiaIndonesiaIranIraqIrelandIsraelItalyJamaicaJapanJordanKazakhstanKenyaKoreaKuwaitLaosLatin AmericaLatviaLebanonLiberiaLithuaniaMalaysiaMexicoMicronesiaMiddle AfricaMoldovaMoroccoNepalNetherlandsNicaraguaNigeriaNorth AmericaNorth MacedoniaNorthern AfricaNorthern EuropeNorwayOceaniaPakistanPanamaPeruPhilippinesPolandPortugalRomaniaRussiaSaudi ArabiaScotlandSenegalSerbiaSierra LeoneSingaporeSomaliaSouth AfricaSouth AmericaSouth Central AsiaSouth Eastern AsiaSouthern EuropeSpainSri LankaSt. Vincent and the GrenadinesSudanSwedenSwitzerlandSyriaThailandTrinidad and TobagoTurkeyUgandaUkraineUruguayUzbekistanVenezuelaVietnamWest IndiesWestern AfricaWestern AsiaWestern EuropeYemenZaireZimbabweAzores
Immigrants from Taiwan
Race
Ancestry
AfghanAfricanAlaska NativeAlaskan AthabascanAlbanianAleutAlsatianAmericanApacheArabArapahoArgentineanArmenianAssyrian/Chaldean/SyriacAustralianAustrianBahamianBangladeshiBarbadianBasqueBelgianBelizeanBermudanBhutaneseBlackfeetBolivianBrazilianBritishBritish West IndianBulgarianBurmeseCajunCambodianCanadianCape VerdeanCarpatho RusynCelticCentral AmericanCentral American IndianCherokeeCheyenneChickasawChileanChineseChippewaChoctawColombianColvilleComancheCosta RicanCreeCreekCroatianCrowCubanCypriotCzechCzechoslovakianDanishDelawareDominicanDutchDutch West IndianEastern EuropeanEcuadorianEgyptianEnglishEstonianEthiopianEuropeanFijianFilipinoFinnishFrenchFrench American IndianFrench CanadianGermanGerman RussianGhanaianGreekGuamanian/ChamorroGuatemalanGuyaneseHaitianHmongHonduranHopiHoumaHungarianIcelanderIndian (Asian)IndonesianInupiatIranianIraqiIrishIroquoisIsraeliItalianJamaicanJapaneseJordanianKenyanKiowaKoreanLaotianLatvianLebaneseLiberianLithuanianLumbeeLuxembourgerMacedonianMalaysianMalteseMarshalleseMenomineeMexicanMexican American IndianMongolianMoroccanNative HawaiianNavajoNepaleseNew ZealanderNicaraguanNigerianNorthern EuropeanNorwegianOkinawanOsageOttawaPaiutePakistaniPalestinianPanamanianParaguayanPennsylvania GermanPeruvianPimaPolishPortuguesePotawatomiPuebloPuerto RicanPuget Sound SalishRomanianRussianSalvadoranSamoanScandinavianScotch-IrishScottishSeminoleSenegaleseSerbianShoshoneSierra LeoneanSiouxSlavicSlovakSloveneSomaliSouth AfricanSouth AmericanSouth American IndianSoviet UnionSpaniardSpanishSpanish AmericanSpanish American IndianSri LankanSubsaharan AfricanSudaneseSwedishSwissSyrianTaiwaneseThaiTlingit-HaidaTohono O'OdhamTonganTrinidadian and TobagonianTsimshianTurkishU.S. Virgin IslanderUgandanUkrainianUruguayanUteVenezuelanVietnameseWelshWest IndianYakamaYaquiYugoslavianYumanYup'ikZimbabwean
Immigration
NonimmigrantsImmigrantsAfghanistanAfricaAlbaniaArgentinaArmeniaAsiaAustraliaAustriaBahamasBangladeshBarbadosBelarusBelgiumBelizeBoliviaBosnia and HerzegovinaBrazilBulgariaBurma/MyanmarCambodiaCameroonCanadaCaribbeanCentral AmericaChileChinaColombiaCongoCosta RicaCroatiaCubaCzechoslovakiaDenmarkDominicaDominican RepublicEastern AfricaEastern AsiaEastern EuropeEcuadorEgyptEl SalvadorEnglandEritreaEthiopiaEuropeFijiFranceGermanyGhanaGreeceGrenadaGuatemalaGuyanaHaitiHondurasHong KongHungaryIndiaIndonesiaIranIraqIrelandIsraelItalyJamaicaJapanJordanKazakhstanKenyaKoreaKuwaitLaosLatin AmericaLatviaLebanonLiberiaLithuaniaMalaysiaMexicoMicronesiaMiddle AfricaMoldovaMoroccoNepalNetherlandsNicaraguaNigeriaNorth AmericaNorth MacedoniaNorthern AfricaNorthern EuropeNorwayOceaniaPakistanPanamaPeruPhilippinesPolandPortugalRomaniaRussiaSaudi ArabiaScotlandSenegalSerbiaSierra LeoneSingaporeSomaliaSouth AfricaSouth AmericaSouth Central AsiaSouth Eastern AsiaSouthern EuropeSpainSri LankaSt. Vincent and the GrenadinesSudanSwedenSwitzerlandSyriaTaiwanThailandTrinidad and TobagoTurkeyUgandaUkraineUruguayUzbekistanVenezuelaVietnamWest IndiesWestern AfricaWestern AsiaWestern EuropeYemenZaireZimbabweAzores
In Labor Force | Age 30-34
Income
Poverty
Unemployment
Labor Participation
Family Structure
Vehicle Availability
Education Level
Disability

In Labor Force | Age 30-34 Comparison

Immigrants from Cabo Verde

Immigrants from Taiwan

Exceptional
Exceptional
86.1%
IN LABOR FORCE | AGE 30-34
100.0/ 100
METRIC RATING
14th/ 347
METRIC RANK
85.3%
IN LABOR FORCE | AGE 30-34
98.3/ 100
METRIC RATING
86th/ 347
METRIC RANK

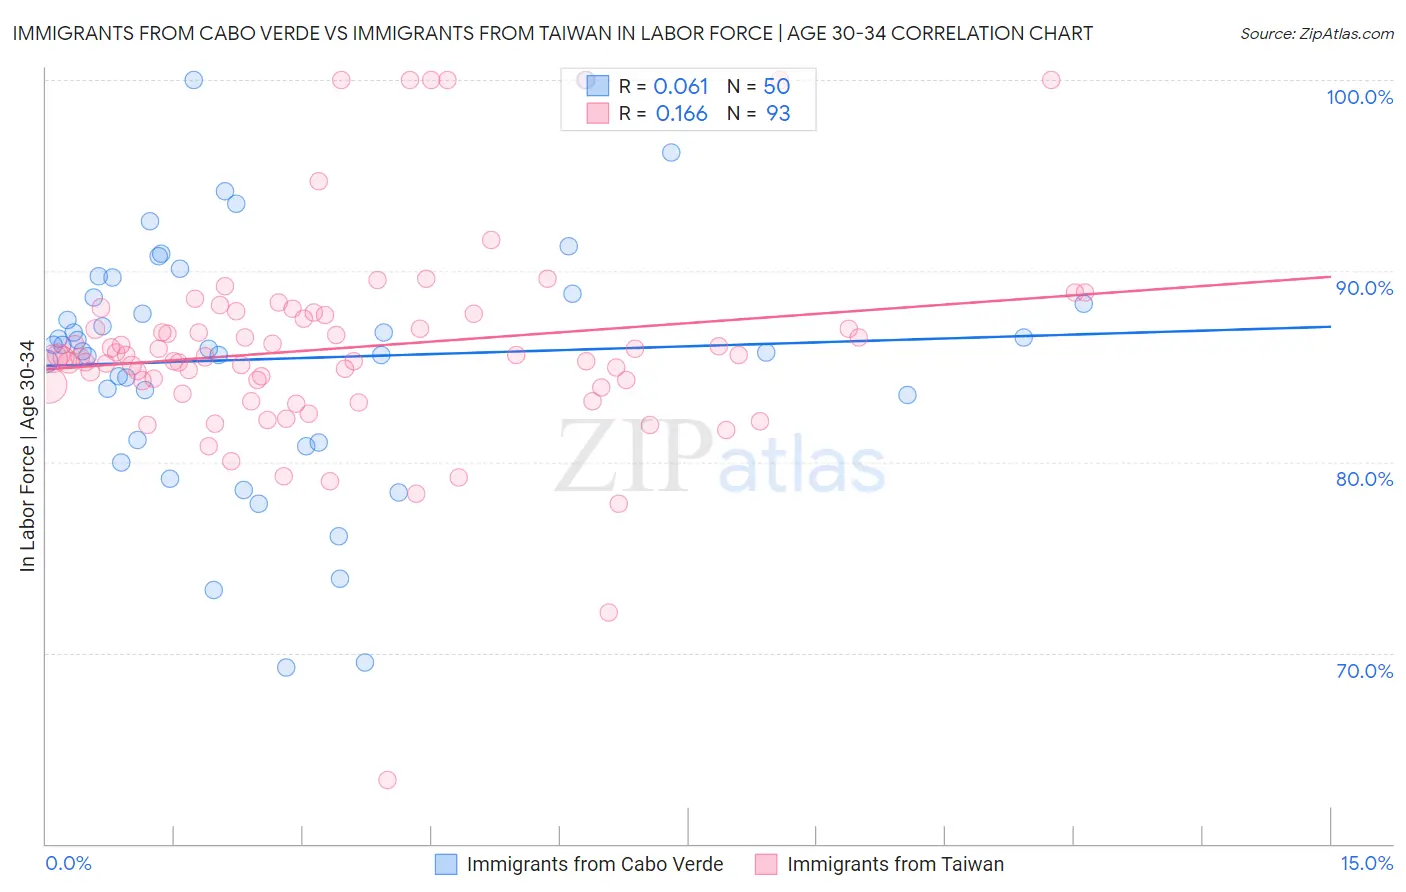
Immigrants from Cabo Verde vs Immigrants from Taiwan In Labor Force | Age 30-34 Correlation Chart

The statistical analysis conducted on geographies consisting of 38,153,074 people shows a slight positive correlation between the proportion of Immigrants from Cabo Verde and labor force participation rate among population between the ages 30 and 34 in the United States with a correlation coefficient (R) of 0.061 and weighted average of 86.1%. Similarly, the statistical analysis conducted on geographies consisting of 298,154,729 people shows a poor positive correlation between the proportion of Immigrants from Taiwan and labor force participation rate among population between the ages 30 and 34 in the United States with a correlation coefficient (R) of 0.166 and weighted average of 85.3%, a difference of 0.94%.
Immigrants from Cabo Verde vs Immigrants from Taiwan In Labor Force | Age 30-34

In Labor Force | Age 30-34 Correlation Summary

MeasurementImmigrants from Cabo VerdeImmigrants from Taiwan
Minimum69.2%63.4%
Maximum100.0%100.0%
Range30.8%36.6%
Mean85.4%86.0%
Median86.0%85.5%
Interquartile 25% (IQ1)81.2%84.0%
Interquartile 75% (IQ3)88.8%87.7%
Interquartile Range (IQR)7.6%3.7%
Standard Deviation (Sample)6.6%5.5%
Standard Deviation (Population)6.5%5.5%

Similar Demographics by In Labor Force | Age 30-34

Demographics Similar to Immigrants from Cabo Verde by In Labor Force | Age 30-34

In terms of in labor force | age 30-34, the demographic groups most similar to Immigrants from Cabo Verde are Immigrants from Croatia (86.1%, a difference of 0.010%), Immigrants from Albania (86.1%, a difference of 0.010%), Bolivian (86.1%, a difference of 0.020%), Latvian (86.0%, a difference of 0.040%), and Immigrants from Cameroon (86.0%, a difference of 0.050%).
DemographicsRating | RankIn Labor Force | Age 30-34
Immigrants | Bolivia
100.0
/100
|
#7
Exceptional
86.2%
Cambodians
100.0
/100
|
#8
Exceptional
86.2%
Immigrants | Somalia
100.0
/100
|
#9
Exceptional
86.2%
Immigrants | Serbia
100.0
/100
|
#10
Exceptional
86.2%
Carpatho Rusyns
100.0
/100
|
#11
Exceptional
86.2%
Bolivians
100.0
/100
|
#12
Exceptional
86.1%
Immigrants | Croatia
100.0
/100
|
#13
Exceptional
86.1%
Immigrants | Cabo Verde
100.0
/100
|
#14
Exceptional
86.1%
Immigrants | Albania
100.0
/100
|
#15
Exceptional
86.1%
Latvians
100.0
/100
|
#16
Exceptional
86.0%
Immigrants | Cameroon
100.0
/100
|
#17
Exceptional
86.0%
Immigrants | Sierra Leone
100.0
/100
|
#18
Exceptional
86.0%
Sierra Leoneans
100.0
/100
|
#19
Exceptional
86.0%
Bulgarians
100.0
/100
|
#20
Exceptional
86.0%
Immigrants | Bulgaria
100.0
/100
|
#21
Exceptional
86.0%

Demographics Similar to Immigrants from Taiwan by In Labor Force | Age 30-34

In terms of in labor force | age 30-34, the demographic groups most similar to Immigrants from Taiwan are Immigrants from Northern Europe (85.3%, a difference of 0.0%), Immigrants from Belgium (85.3%, a difference of 0.010%), Mongolian (85.3%, a difference of 0.020%), Immigrants from Kazakhstan (85.3%, a difference of 0.020%), and Greek (85.3%, a difference of 0.030%).
DemographicsRating | RankIn Labor Force | Age 30-34
Immigrants | Switzerland
98.7
/100
|
#79
Exceptional
85.3%
Immigrants | Russia
98.7
/100
|
#80
Exceptional
85.3%
Slovaks
98.7
/100
|
#81
Exceptional
85.3%
Immigrants | Africa
98.6
/100
|
#82
Exceptional
85.3%
Immigrants | Europe
98.6
/100
|
#83
Exceptional
85.3%
Greeks
98.6
/100
|
#84
Exceptional
85.3%
Mongolians
98.5
/100
|
#85
Exceptional
85.3%
Immigrants | Taiwan
98.3
/100
|
#86
Exceptional
85.3%
Immigrants | Northern Europe
98.2
/100
|
#87
Exceptional
85.3%
Immigrants | Belgium
98.2
/100
|
#88
Exceptional
85.3%
Immigrants | Kazakhstan
98.1
/100
|
#89
Exceptional
85.3%
Burmese
97.9
/100
|
#90
Exceptional
85.3%
Immigrants | Moldova
97.9
/100
|
#91
Exceptional
85.3%
German Russians
97.7
/100
|
#92
Exceptional
85.2%
Immigrants | Norway
97.6
/100
|
#93
Exceptional
85.2%