Immigrants from Cabo Verde vs Egyptian In Labor Force | Age 45-54
COMPARE
Immigrants from Cabo Verde
Egyptian
In Labor Force | Age 45-54
In Labor Force | Age 45-54 Comparison
Immigrants from Cabo Verde
Egyptians
82.3%
IN LABOR FORCE | AGE 45-54
8.6/ 100
METRIC RATING
207th/ 347
METRIC RANK
83.5%
IN LABOR FORCE | AGE 45-54
97.9/ 100
METRIC RATING
65th/ 347
METRIC RANK
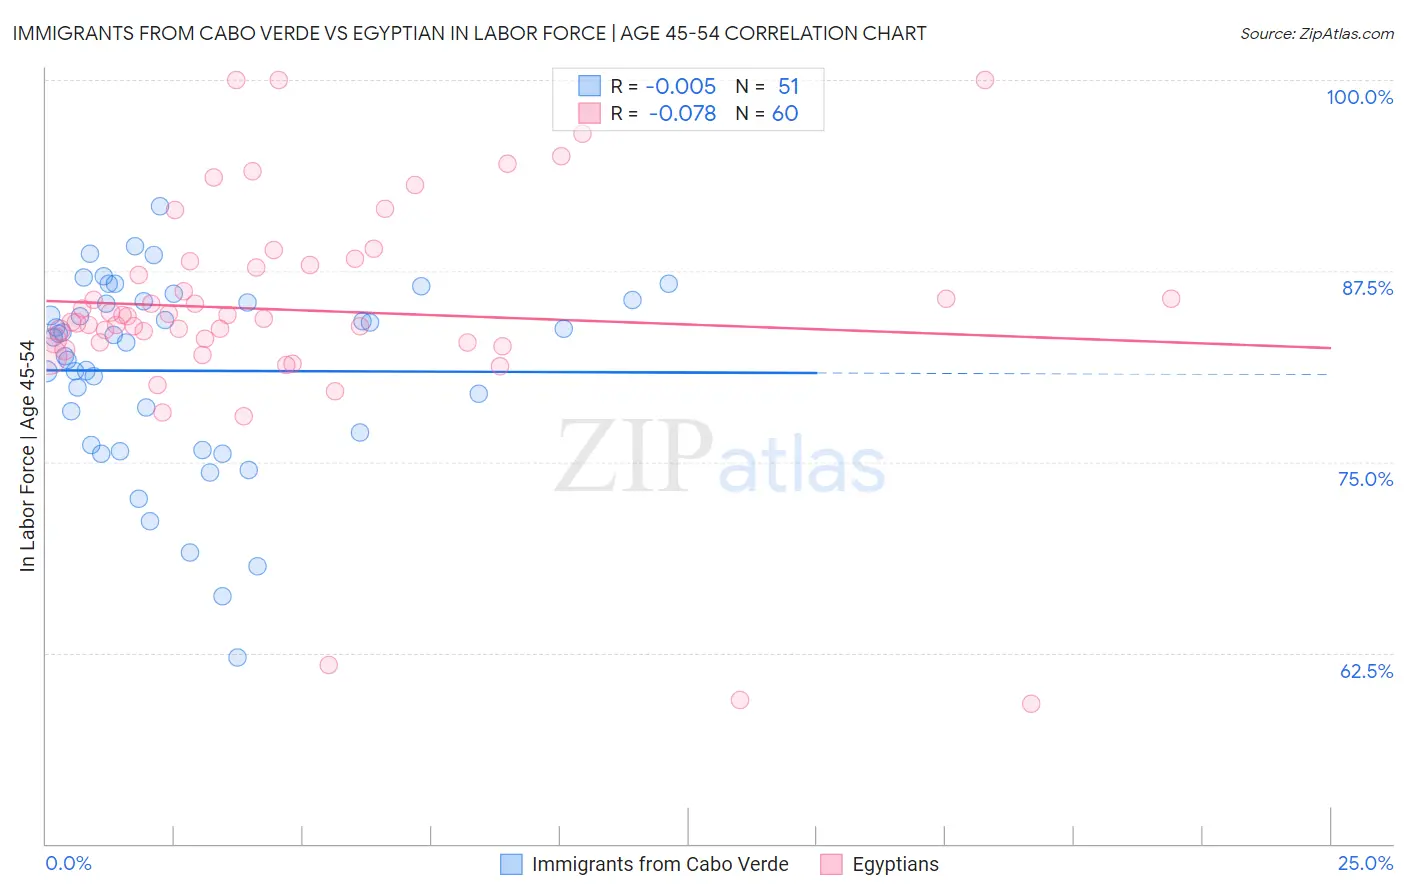
Immigrants from Cabo Verde vs Egyptian In Labor Force | Age 45-54 Correlation Chart
The statistical analysis conducted on geographies consisting of 38,135,019 people shows no correlation between the proportion of Immigrants from Cabo Verde and labor force participation rate among population between the ages 45 and 54 in the United States with a correlation coefficient (R) of -0.005 and weighted average of 82.3%. Similarly, the statistical analysis conducted on geographies consisting of 276,763,301 people shows a slight negative correlation between the proportion of Egyptians and labor force participation rate among population between the ages 45 and 54 in the United States with a correlation coefficient (R) of -0.078 and weighted average of 83.5%, a difference of 1.4%.
In Labor Force | Age 45-54 Correlation Summary
| Measurement | Immigrants from Cabo Verde | Egyptian |
| Minimum | 62.2% | 59.2% |
| Maximum | 91.7% | 100.0% |
| Range | 29.5% | 40.8% |
| Mean | 81.0% | 84.9% |
| Median | 83.1% | 84.5% |
| Interquartile 25% (IQ1) | 76.1% | 82.8% |
| Interquartile 75% (IQ3) | 85.5% | 88.0% |
| Interquartile Range (IQR) | 9.4% | 5.2% |
| Standard Deviation (Sample) | 6.3% | 7.7% |
| Standard Deviation (Population) | 6.3% | 7.6% |
Similar Demographics by In Labor Force | Age 45-54
Demographics Similar to Immigrants from Cabo Verde by In Labor Force | Age 45-54
In terms of in labor force | age 45-54, the demographic groups most similar to Immigrants from Cabo Verde are Native Hawaiian (82.3%, a difference of 0.0%), Welsh (82.3%, a difference of 0.020%), Senegalese (82.4%, a difference of 0.030%), Immigrants from Lebanon (82.3%, a difference of 0.040%), and Immigrants from Bahamas (82.3%, a difference of 0.040%).
| Demographics | Rating | Rank | In Labor Force | Age 45-54 |
| French Canadians | 15.4 /100 | #200 | Poor 82.5% |
| Canadians | 15.1 /100 | #201 | Poor 82.4% |
| Immigrants | Western Asia | 14.9 /100 | #202 | Poor 82.4% |
| Arabs | 11.6 /100 | #203 | Poor 82.4% |
| Immigrants | Western Europe | 10.9 /100 | #204 | Poor 82.4% |
| Senegalese | 9.5 /100 | #205 | Tragic 82.4% |
| Welsh | 9.2 /100 | #206 | Tragic 82.3% |
| Immigrants | Cabo Verde | 8.6 /100 | #207 | Tragic 82.3% |
| Native Hawaiians | 8.5 /100 | #208 | Tragic 82.3% |
| Immigrants | Lebanon | 7.4 /100 | #209 | Tragic 82.3% |
| Immigrants | Bahamas | 7.1 /100 | #210 | Tragic 82.3% |
| Immigrants | Syria | 6.6 /100 | #211 | Tragic 82.3% |
| Ecuadorians | 6.3 /100 | #212 | Tragic 82.3% |
| Immigrants | Uzbekistan | 5.8 /100 | #213 | Tragic 82.3% |
| Immigrants | Panama | 5.6 /100 | #214 | Tragic 82.2% |
Demographics Similar to Egyptians by In Labor Force | Age 45-54
In terms of in labor force | age 45-54, the demographic groups most similar to Egyptians are Immigrants from Kenya (83.5%, a difference of 0.0%), Afghan (83.5%, a difference of 0.010%), Asian (83.4%, a difference of 0.010%), Chilean (83.4%, a difference of 0.010%), and Immigrants from Taiwan (83.5%, a difference of 0.020%).
| Demographics | Rating | Rank | In Labor Force | Age 45-54 |
| Eastern Europeans | 98.5 /100 | #58 | Exceptional 83.5% |
| Bhutanese | 98.3 /100 | #59 | Exceptional 83.5% |
| Carpatho Rusyns | 98.3 /100 | #60 | Exceptional 83.5% |
| Filipinos | 98.3 /100 | #61 | Exceptional 83.5% |
| Immigrants | Taiwan | 98.0 /100 | #62 | Exceptional 83.5% |
| Afghans | 97.9 /100 | #63 | Exceptional 83.5% |
| Immigrants | Kenya | 97.9 /100 | #64 | Exceptional 83.5% |
| Egyptians | 97.9 /100 | #65 | Exceptional 83.5% |
| Asians | 97.7 /100 | #66 | Exceptional 83.4% |
| Chileans | 97.7 /100 | #67 | Exceptional 83.4% |
| Immigrants | Colombia | 97.6 /100 | #68 | Exceptional 83.4% |
| Taiwanese | 97.5 /100 | #69 | Exceptional 83.4% |
| Immigrants | Latvia | 97.4 /100 | #70 | Exceptional 83.4% |
| Colombians | 97.3 /100 | #71 | Exceptional 83.4% |
| Serbians | 97.2 /100 | #72 | Exceptional 83.4% |