Immigrants from Bosnia and Herzegovina vs European In Labor Force | Age 20-24

COMPARE

Immigrants from Bosnia and Herzegovina
Race
Ancestry
AfghanAfricanAlaska NativeAlaskan AthabascanAlbanianAleutAlsatianAmericanApacheArabArapahoArgentineanArmenianAssyrian/Chaldean/SyriacAustralianAustrianBahamianBangladeshiBarbadianBasqueBelgianBelizeanBermudanBhutaneseBlackfeetBolivianBrazilianBritishBritish West IndianBulgarianBurmeseCajunCambodianCanadianCape VerdeanCarpatho RusynCelticCentral AmericanCentral American IndianCherokeeCheyenneChickasawChileanChineseChippewaChoctawColombianColvilleComancheCosta RicanCreeCreekCroatianCrowCubanCypriotCzechCzechoslovakianDanishDelawareDominicanDutchDutch West IndianEastern EuropeanEcuadorianEgyptianEnglishEstonianEthiopianFijianFilipinoFinnishFrenchFrench American IndianFrench CanadianGermanGerman RussianGhanaianGreekGuamanian/ChamorroGuatemalanGuyaneseHaitianHmongHonduranHopiHoumaHungarianIcelanderIndian (Asian)IndonesianInupiatIranianIraqiIrishIroquoisIsraeliItalianJamaicanJapaneseJordanianKenyanKiowaKoreanLaotianLatvianLebaneseLiberianLithuanianLumbeeLuxembourgerMacedonianMalaysianMalteseMarshalleseMenomineeMexicanMexican American IndianMongolianMoroccanNative HawaiianNavajoNepaleseNew ZealanderNicaraguanNigerianNorthern EuropeanNorwegianOkinawanOsageOttawaPaiutePakistaniPalestinianPanamanianParaguayanPennsylvania GermanPeruvianPimaPolishPortuguesePotawatomiPuebloPuerto RicanPuget Sound SalishRomanianRussianSalvadoranSamoanScandinavianScotch-IrishScottishSeminoleSenegaleseSerbianShoshoneSierra LeoneanSiouxSlavicSlovakSloveneSomaliSouth AfricanSouth AmericanSouth American IndianSoviet UnionSpaniardSpanishSpanish AmericanSpanish American IndianSri LankanSubsaharan AfricanSudaneseSwedishSwissSyrianTaiwaneseThaiTlingit-HaidaTohono O'OdhamTonganTrinidadian and TobagonianTsimshianTurkishU.S. Virgin IslanderUgandanUkrainianUruguayanUteVenezuelanVietnameseWelshWest IndianYakamaYaquiYugoslavianYumanYup'ikZimbabwean
Immigration
NonimmigrantsImmigrantsAfghanistanAfricaAlbaniaArgentinaArmeniaAsiaAustraliaAustriaBahamasBangladeshBarbadosBelarusBelgiumBelizeBoliviaBosnia and HerzegovinaBrazilBulgariaBurma/MyanmarCabo VerdeCambodiaCameroonCanadaCaribbeanCentral AmericaChileChinaColombiaCongoCosta RicaCroatiaCubaCzechoslovakiaDenmarkDominicaDominican RepublicEastern AfricaEastern AsiaEastern EuropeEcuadorEgyptEl SalvadorEnglandEritreaEthiopiaEuropeFijiFranceGermanyGhanaGreeceGrenadaGuatemalaGuyanaHaitiHondurasHong KongHungaryIndiaIndonesiaIranIraqIrelandIsraelItalyJamaicaJapanJordanKazakhstanKenyaKoreaKuwaitLaosLatin AmericaLatviaLebanonLiberiaLithuaniaMalaysiaMexicoMicronesiaMiddle AfricaMoldovaMoroccoNepalNetherlandsNicaraguaNigeriaNorth AmericaNorth MacedoniaNorthern AfricaNorthern EuropeNorwayOceaniaPakistanPanamaPeruPhilippinesPolandPortugalRomaniaRussiaSaudi ArabiaScotlandSenegalSerbiaSierra LeoneSingaporeSomaliaSouth AfricaSouth AmericaSouth Central AsiaSouth Eastern AsiaSouthern EuropeSpainSri LankaSt. Vincent and the GrenadinesSudanSwedenSwitzerlandSyriaTaiwanThailandTrinidad and TobagoTurkeyUgandaUkraineUruguayUzbekistanVenezuelaVietnamWest IndiesWestern AfricaWestern AsiaWestern EuropeYemenZaireZimbabweAzores
European
Race
Ancestry
AfghanAfricanAlaska NativeAlaskan AthabascanAlbanianAleutAlsatianAmericanApacheArabArapahoArgentineanArmenianAssyrian/Chaldean/SyriacAustralianAustrianBahamianBangladeshiBarbadianBasqueBelgianBelizeanBermudanBhutaneseBlackfeetBolivianBrazilianBritishBritish West IndianBulgarianBurmeseCajunCambodianCanadianCape VerdeanCarpatho RusynCelticCentral AmericanCentral American IndianCherokeeCheyenneChickasawChileanChineseChippewaChoctawColombianColvilleComancheCosta RicanCreeCreekCroatianCrowCubanCypriotCzechCzechoslovakianDanishDelawareDominicanDutchDutch West IndianEastern EuropeanEcuadorianEgyptianEnglishEstonianEthiopianEuropeanFijianFilipinoFinnishFrenchFrench American IndianFrench CanadianGermanGerman RussianGhanaianGreekGuamanian/ChamorroGuatemalanGuyaneseHaitianHmongHonduranHopiHoumaHungarianIcelanderIndian (Asian)IndonesianInupiatIranianIraqiIrishIroquoisIsraeliItalianJamaicanJapaneseJordanianKenyanKiowaKoreanLaotianLatvianLebaneseLiberianLithuanianLumbeeLuxembourgerMacedonianMalaysianMalteseMarshalleseMenomineeMexicanMexican American IndianMongolianMoroccanNative HawaiianNavajoNepaleseNew ZealanderNicaraguanNigerianNorthern EuropeanNorwegianOkinawanOsageOttawaPaiutePakistaniPalestinianPanamanianParaguayanPennsylvania GermanPeruvianPimaPolishPortuguesePotawatomiPuebloPuerto RicanPuget Sound SalishRomanianRussianSalvadoranSamoanScandinavianScotch-IrishScottishSeminoleSenegaleseSerbianShoshoneSierra LeoneanSiouxSlavicSlovakSloveneSomaliSouth AfricanSouth AmericanSouth American IndianSoviet UnionSpaniardSpanishSpanish AmericanSpanish American IndianSri LankanSubsaharan AfricanSudaneseSwedishSwissSyrianTaiwaneseThaiTlingit-HaidaTohono O'OdhamTonganTrinidadian and TobagonianTsimshianTurkishU.S. Virgin IslanderUgandanUkrainianUruguayanUteVenezuelanVietnameseWelshWest IndianYakamaYaquiYugoslavianYumanYup'ikZimbabwean
Immigration
NonimmigrantsImmigrantsAfghanistanAfricaAlbaniaArgentinaArmeniaAsiaAustraliaAustriaBahamasBangladeshBarbadosBelarusBelgiumBelizeBoliviaBrazilBulgariaBurma/MyanmarCabo VerdeCambodiaCameroonCanadaCaribbeanCentral AmericaChileChinaColombiaCongoCosta RicaCroatiaCubaCzechoslovakiaDenmarkDominicaDominican RepublicEastern AfricaEastern AsiaEastern EuropeEcuadorEgyptEl SalvadorEnglandEritreaEthiopiaEuropeFijiFranceGermanyGhanaGreeceGrenadaGuatemalaGuyanaHaitiHondurasHong KongHungaryIndiaIndonesiaIranIraqIrelandIsraelItalyJamaicaJapanJordanKazakhstanKenyaKoreaKuwaitLaosLatin AmericaLatviaLebanonLiberiaLithuaniaMalaysiaMexicoMicronesiaMiddle AfricaMoldovaMoroccoNepalNetherlandsNicaraguaNigeriaNorth AmericaNorth MacedoniaNorthern AfricaNorthern EuropeNorwayOceaniaPakistanPanamaPeruPhilippinesPolandPortugalRomaniaRussiaSaudi ArabiaScotlandSenegalSerbiaSierra LeoneSingaporeSomaliaSouth AfricaSouth AmericaSouth Central AsiaSouth Eastern AsiaSouthern EuropeSpainSri LankaSt. Vincent and the GrenadinesSudanSwedenSwitzerlandSyriaTaiwanThailandTrinidad and TobagoTurkeyUgandaUkraineUruguayUzbekistanVenezuelaVietnamWest IndiesWestern AfricaWestern AsiaWestern EuropeYemenZaireZimbabweAzores
In Labor Force | Age 20-24
Income
Poverty
Unemployment
Labor Participation
Family Structure
Vehicle Availability
Education Level
Disability

In Labor Force | Age 20-24 Comparison

Immigrants from Bosnia and Herzegovina

Europeans

Exceptional
Exceptional
78.1%
IN LABOR FORCE | AGE 20-24
100.0/ 100
METRIC RATING
18th/ 347
METRIC RANK
77.1%
IN LABOR FORCE | AGE 20-24
99.9/ 100
METRIC RATING
56th/ 347
METRIC RANK

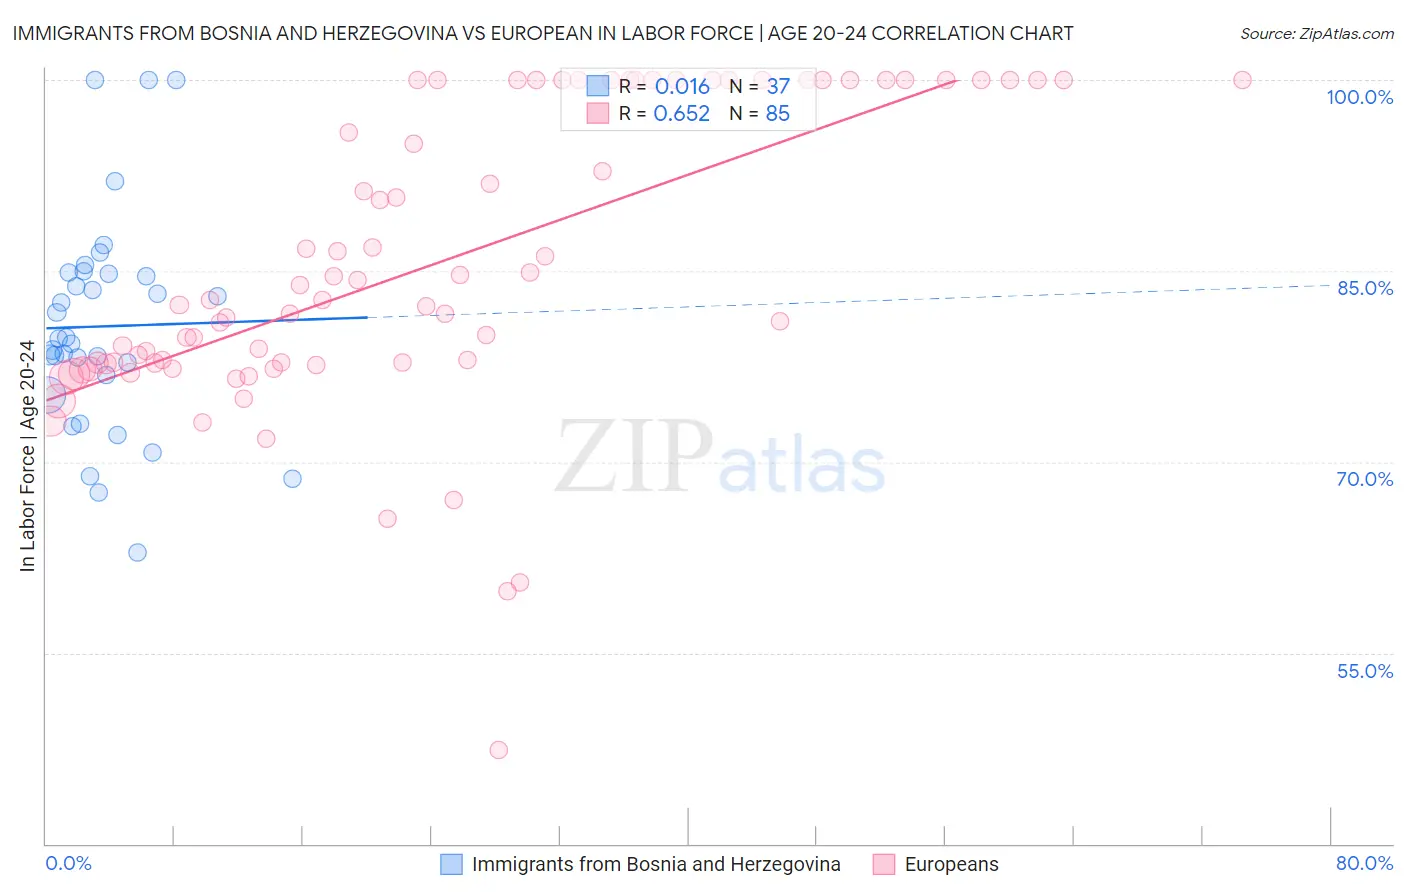
Immigrants from Bosnia and Herzegovina vs European In Labor Force | Age 20-24 Correlation Chart

The statistical analysis conducted on geographies consisting of 156,811,571 people shows no correlation between the proportion of Immigrants from Bosnia and Herzegovina and labor force participation rate among population between the ages 20 and 24 in the United States with a correlation coefficient (R) of 0.016 and weighted average of 78.1%. Similarly, the statistical analysis conducted on geographies consisting of 560,672,794 people shows a significant positive correlation between the proportion of Europeans and labor force participation rate among population between the ages 20 and 24 in the United States with a correlation coefficient (R) of 0.652 and weighted average of 77.1%, a difference of 1.3%.
Immigrants from Bosnia and Herzegovina vs European In Labor Force | Age 20-24

In Labor Force | Age 20-24 Correlation Summary

MeasurementImmigrants from Bosnia and HerzegovinaEuropean
Minimum62.9%47.4%
Maximum100.0%100.0%
Range37.1%52.6%
Mean80.6%85.5%
Median79.7%82.7%
Interquartile 25% (IQ1)76.0%77.7%
Interquartile 75% (IQ3)84.8%100.0%
Interquartile Range (IQR)8.8%22.3%
Standard Deviation (Sample)8.5%11.7%
Standard Deviation (Population)8.4%11.6%

Similar Demographics by In Labor Force | Age 20-24

Demographics Similar to Immigrants from Bosnia and Herzegovina by In Labor Force | Age 20-24

In terms of in labor force | age 20-24, the demographic groups most similar to Immigrants from Bosnia and Herzegovina are Bangladeshi (78.1%, a difference of 0.0%), French Canadian (78.1%, a difference of 0.070%), Puget Sound Salish (78.0%, a difference of 0.14%), Pennsylvania German (78.0%, a difference of 0.20%), and Yugoslavian (78.0%, a difference of 0.21%).
DemographicsRating | RankIn Labor Force | Age 20-24
Finns
100.0
/100
|
#11
Exceptional
78.7%
Germans
100.0
/100
|
#12
Exceptional
78.6%
Scandinavians
100.0
/100
|
#13
Exceptional
78.5%
Czechs
100.0
/100
|
#14
Exceptional
78.5%
Sudanese
100.0
/100
|
#15
Exceptional
78.4%
Dutch
100.0
/100
|
#16
Exceptional
78.4%
Cape Verdeans
100.0
/100
|
#17
Exceptional
78.3%
Immigrants | Bosnia and Herzegovina
100.0
/100
|
#18
Exceptional
78.1%
Bangladeshis
100.0
/100
|
#19
Exceptional
78.1%
French Canadians
100.0
/100
|
#20
Exceptional
78.1%
Puget Sound Salish
100.0
/100
|
#21
Exceptional
78.0%
Pennsylvania Germans
100.0
/100
|
#22
Exceptional
78.0%
Yugoslavians
100.0
/100
|
#23
Exceptional
78.0%
Liberians
100.0
/100
|
#24
Exceptional
78.0%
Tlingit-Haida
100.0
/100
|
#25
Exceptional
77.9%

Demographics Similar to Europeans by In Labor Force | Age 20-24

In terms of in labor force | age 20-24, the demographic groups most similar to Europeans are Immigrants from Liberia (77.1%, a difference of 0.010%), Chippewa (77.1%, a difference of 0.020%), Celtic (77.1%, a difference of 0.030%), Hawaiian (77.0%, a difference of 0.040%), and Scotch-Irish (77.0%, a difference of 0.060%).
DemographicsRating | RankIn Labor Force | Age 20-24
Chinese
100.0
/100
|
#49
Exceptional
77.3%
Malaysians
100.0
/100
|
#50
Exceptional
77.2%
Croatians
100.0
/100
|
#51
Exceptional
77.2%
Indonesians
100.0
/100
|
#52
Exceptional
77.2%
Immigrants | Azores
100.0
/100
|
#53
Exceptional
77.2%
Celtics
99.9
/100
|
#54
Exceptional
77.1%
Immigrants | Liberia
99.9
/100
|
#55
Exceptional
77.1%
Europeans
99.9
/100
|
#56
Exceptional
77.1%
Chippewa
99.9
/100
|
#57
Exceptional
77.1%
Hawaiians
99.9
/100
|
#58
Exceptional
77.0%
Scotch-Irish
99.9
/100
|
#59
Exceptional
77.0%
Kenyans
99.9
/100
|
#60
Exceptional
77.0%
Immigrants | Eritrea
99.9
/100
|
#61
Exceptional
77.0%
Immigrants | Kenya
99.9
/100
|
#62
Exceptional
77.0%
Lithuanians
99.9
/100
|
#63
Exceptional
77.0%