Immigrants from Belize vs Colville In Labor Force | Age 25-29
COMPARE
Immigrants from Belize
Colville
In Labor Force | Age 25-29
In Labor Force | Age 25-29 Comparison
Immigrants from Belize
Colville
82.8%
IN LABOR FORCE | AGE 25-29
0.0/ 100
METRIC RATING
302nd/ 347
METRIC RANK
81.6%
IN LABOR FORCE | AGE 25-29
0.0/ 100
METRIC RATING
320th/ 347
METRIC RANK
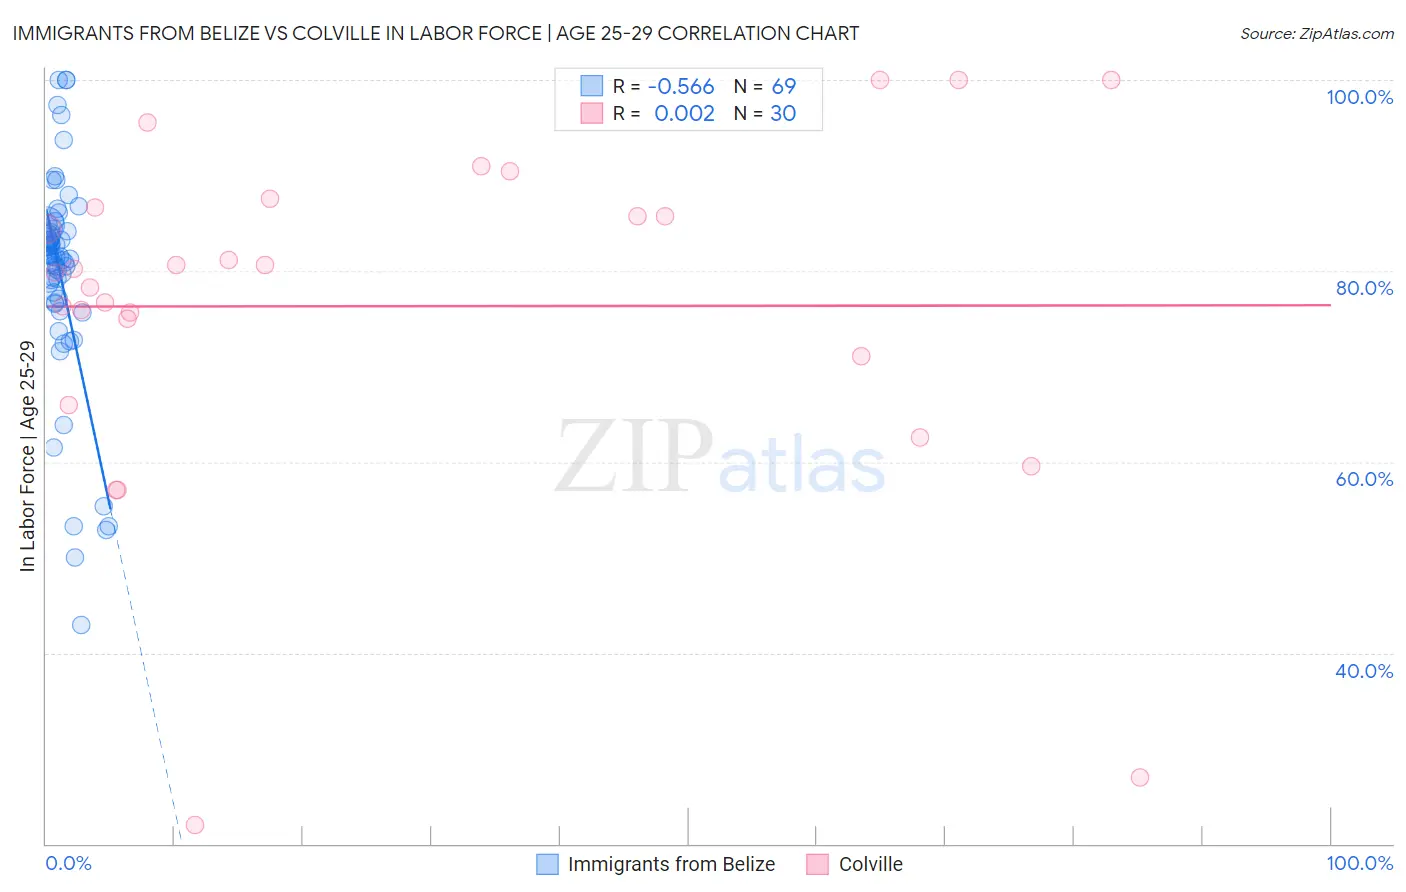
Immigrants from Belize vs Colville In Labor Force | Age 25-29 Correlation Chart
The statistical analysis conducted on geographies consisting of 130,310,210 people shows a substantial negative correlation between the proportion of Immigrants from Belize and labor force participation rate among population between the ages 25 and 29 in the United States with a correlation coefficient (R) of -0.566 and weighted average of 82.8%. Similarly, the statistical analysis conducted on geographies consisting of 34,682,353 people shows no correlation between the proportion of Colville and labor force participation rate among population between the ages 25 and 29 in the United States with a correlation coefficient (R) of 0.002 and weighted average of 81.6%, a difference of 1.4%.
In Labor Force | Age 25-29 Correlation Summary
| Measurement | Immigrants from Belize | Colville |
| Minimum | 42.9% | 21.9% |
| Maximum | 100.0% | 100.0% |
| Range | 57.1% | 78.1% |
| Mean | 79.6% | 76.3% |
| Median | 81.5% | 80.1% |
| Interquartile 25% (IQ1) | 76.9% | 71.0% |
| Interquartile 75% (IQ3) | 84.3% | 86.6% |
| Interquartile Range (IQR) | 7.5% | 15.6% |
| Standard Deviation (Sample) | 11.3% | 18.4% |
| Standard Deviation (Population) | 11.2% | 18.1% |
Demographics Similar to Immigrants from Belize and Colville by In Labor Force | Age 25-29
In terms of in labor force | age 25-29, the demographic groups most similar to Immigrants from Belize are Immigrants from Grenada (82.8%, a difference of 0.010%), Vietnamese (82.8%, a difference of 0.030%), Immigrants from St. Vincent and the Grenadines (82.7%, a difference of 0.14%), Black/African American (82.6%, a difference of 0.26%), and Blackfeet (82.6%, a difference of 0.27%). Similarly, the demographic groups most similar to Colville are Seminole (81.7%, a difference of 0.050%), Shoshone (81.6%, a difference of 0.060%), Comanche (81.9%, a difference of 0.27%), Chickasaw (81.9%, a difference of 0.28%), and Mexican (81.9%, a difference of 0.35%).
| Demographics | Rating | Rank | In Labor Force | Age 25-29 |
| Vietnamese | 0.0 /100 | #301 | Tragic 82.8% |
| Immigrants | Belize | 0.0 /100 | #302 | Tragic 82.8% |
| Immigrants | Grenada | 0.0 /100 | #303 | Tragic 82.8% |
| Immigrants | St. Vincent and the Grenadines | 0.0 /100 | #304 | Tragic 82.7% |
| Blacks/African Americans | 0.0 /100 | #305 | Tragic 82.6% |
| Blackfeet | 0.0 /100 | #306 | Tragic 82.6% |
| Cajuns | 0.0 /100 | #307 | Tragic 82.5% |
| Central American Indians | 0.0 /100 | #308 | Tragic 82.4% |
| Immigrants | Central America | 0.0 /100 | #309 | Tragic 82.4% |
| Osage | 0.0 /100 | #310 | Tragic 82.3% |
| Alaskan Athabascans | 0.0 /100 | #311 | Tragic 82.3% |
| Hispanics or Latinos | 0.0 /100 | #312 | Tragic 82.2% |
| Yaqui | 0.0 /100 | #313 | Tragic 82.2% |
| Cherokee | 0.0 /100 | #314 | Tragic 82.1% |
| Immigrants | Mexico | 0.0 /100 | #315 | Tragic 82.0% |
| Mexicans | 0.0 /100 | #316 | Tragic 81.9% |
| Chickasaw | 0.0 /100 | #317 | Tragic 81.9% |
| Comanche | 0.0 /100 | #318 | Tragic 81.9% |
| Seminole | 0.0 /100 | #319 | Tragic 81.7% |
| Colville | 0.0 /100 | #320 | Tragic 81.6% |
| Shoshone | 0.0 /100 | #321 | Tragic 81.6% |