Immigrants from Belgium vs Immigrants from Germany In Labor Force | Age 20-24

COMPARE

Immigrants from Belgium
Race
Ancestry
AfghanAfricanAlaska NativeAlaskan AthabascanAlbanianAleutAlsatianAmericanApacheArabArapahoArgentineanArmenianAssyrian/Chaldean/SyriacAustralianAustrianBahamianBangladeshiBarbadianBasqueBelgianBelizeanBermudanBhutaneseBlackfeetBolivianBrazilianBritishBritish West IndianBulgarianBurmeseCajunCambodianCanadianCape VerdeanCarpatho RusynCelticCentral AmericanCentral American IndianCherokeeCheyenneChickasawChileanChineseChippewaChoctawColombianColvilleComancheCosta RicanCreeCreekCroatianCrowCubanCypriotCzechCzechoslovakianDanishDelawareDominicanDutchDutch West IndianEastern EuropeanEcuadorianEgyptianEnglishEstonianEthiopianEuropeanFijianFilipinoFinnishFrenchFrench American IndianFrench CanadianGermanGerman RussianGhanaianGreekGuamanian/ChamorroGuatemalanGuyaneseHaitianHmongHonduranHopiHoumaHungarianIcelanderIndian (Asian)IndonesianInupiatIranianIraqiIrishIroquoisIsraeliItalianJamaicanJapaneseJordanianKenyanKiowaKoreanLaotianLatvianLebaneseLiberianLithuanianLumbeeLuxembourgerMacedonianMalaysianMalteseMarshalleseMenomineeMexicanMexican American IndianMongolianMoroccanNative HawaiianNavajoNepaleseNew ZealanderNicaraguanNigerianNorthern EuropeanNorwegianOkinawanOsageOttawaPaiutePakistaniPalestinianPanamanianParaguayanPennsylvania GermanPeruvianPimaPolishPortuguesePotawatomiPuebloPuerto RicanPuget Sound SalishRomanianRussianSalvadoranSamoanScandinavianScotch-IrishScottishSeminoleSenegaleseSerbianShoshoneSierra LeoneanSiouxSlavicSlovakSloveneSomaliSouth AfricanSouth AmericanSouth American IndianSoviet UnionSpaniardSpanishSpanish AmericanSpanish American IndianSri LankanSubsaharan AfricanSudaneseSwedishSwissSyrianTaiwaneseThaiTlingit-HaidaTohono O'OdhamTonganTrinidadian and TobagonianTsimshianTurkishU.S. Virgin IslanderUgandanUkrainianUruguayanUteVenezuelanVietnameseWelshWest IndianYakamaYaquiYugoslavianYumanYup'ikZimbabwean
Immigration
NonimmigrantsImmigrantsAfghanistanAfricaAlbaniaArgentinaArmeniaAsiaAustraliaAustriaBahamasBangladeshBarbadosBelarusBelgiumBelizeBoliviaBosnia and HerzegovinaBrazilBulgariaBurma/MyanmarCabo VerdeCambodiaCameroonCanadaCaribbeanCentral AmericaChileChinaColombiaCongoCosta RicaCroatiaCubaCzechoslovakiaDenmarkDominicaDominican RepublicEastern AfricaEastern AsiaEastern EuropeEcuadorEgyptEl SalvadorEnglandEritreaEthiopiaEuropeFijiFranceGhanaGreeceGrenadaGuatemalaGuyanaHaitiHondurasHong KongHungaryIndiaIndonesiaIranIraqIrelandIsraelItalyJamaicaJapanJordanKazakhstanKenyaKoreaKuwaitLaosLatin AmericaLatviaLebanonLiberiaLithuaniaMalaysiaMexicoMicronesiaMiddle AfricaMoldovaMoroccoNepalNetherlandsNicaraguaNigeriaNorth AmericaNorth MacedoniaNorthern AfricaNorthern EuropeNorwayOceaniaPakistanPanamaPeruPhilippinesPolandPortugalRomaniaRussiaSaudi ArabiaScotlandSenegalSerbiaSierra LeoneSingaporeSomaliaSouth AfricaSouth AmericaSouth Central AsiaSouth Eastern AsiaSouthern EuropeSpainSri LankaSt. Vincent and the GrenadinesSudanSwedenSwitzerlandSyriaTaiwanThailandTrinidad and TobagoTurkeyUgandaUkraineUruguayUzbekistanVenezuelaVietnamWest IndiesWestern AfricaWestern AsiaWestern EuropeYemenZaireZimbabweAzores
Immigrants from Germany
Race
Ancestry
AfghanAfricanAlaska NativeAlaskan AthabascanAlbanianAleutAlsatianAmericanApacheArabArapahoArgentineanArmenianAssyrian/Chaldean/SyriacAustralianAustrianBahamianBangladeshiBarbadianBasqueBelgianBelizeanBermudanBhutaneseBlackfeetBolivianBrazilianBritishBritish West IndianBulgarianBurmeseCajunCambodianCanadianCape VerdeanCarpatho RusynCelticCentral AmericanCentral American IndianCherokeeCheyenneChickasawChileanChineseChippewaChoctawColombianColvilleComancheCosta RicanCreeCreekCroatianCrowCubanCypriotCzechCzechoslovakianDanishDelawareDominicanDutchDutch West IndianEastern EuropeanEcuadorianEgyptianEnglishEstonianEthiopianEuropeanFijianFilipinoFinnishFrenchFrench American IndianFrench CanadianGermanGerman RussianGhanaianGreekGuamanian/ChamorroGuatemalanGuyaneseHaitianHmongHonduranHopiHoumaHungarianIcelanderIndian (Asian)IndonesianInupiatIranianIraqiIrishIroquoisIsraeliItalianJamaicanJapaneseJordanianKenyanKiowaKoreanLaotianLatvianLebaneseLiberianLithuanianLumbeeLuxembourgerMacedonianMalaysianMalteseMarshalleseMenomineeMexicanMexican American IndianMongolianMoroccanNative HawaiianNavajoNepaleseNew ZealanderNicaraguanNigerianNorthern EuropeanNorwegianOkinawanOsageOttawaPaiutePakistaniPalestinianPanamanianParaguayanPennsylvania GermanPeruvianPimaPolishPortuguesePotawatomiPuebloPuerto RicanPuget Sound SalishRomanianRussianSalvadoranSamoanScandinavianScotch-IrishScottishSeminoleSenegaleseSerbianShoshoneSierra LeoneanSiouxSlavicSlovakSloveneSomaliSouth AfricanSouth AmericanSouth American IndianSoviet UnionSpaniardSpanishSpanish AmericanSpanish American IndianSri LankanSubsaharan AfricanSudaneseSwedishSwissSyrianTaiwaneseThaiTlingit-HaidaTohono O'OdhamTonganTrinidadian and TobagonianTsimshianTurkishU.S. Virgin IslanderUgandanUkrainianUruguayanUteVenezuelanVietnameseWelshWest IndianYakamaYaquiYugoslavianYumanYup'ikZimbabwean
Immigration
NonimmigrantsImmigrantsAfghanistanAfricaAlbaniaArgentinaArmeniaAsiaAustraliaAustriaBahamasBangladeshBarbadosBelarusBelizeBoliviaBosnia and HerzegovinaBrazilBulgariaBurma/MyanmarCabo VerdeCambodiaCameroonCanadaCaribbeanCentral AmericaChileChinaColombiaCongoCosta RicaCroatiaCubaCzechoslovakiaDenmarkDominicaDominican RepublicEastern AfricaEastern AsiaEastern EuropeEcuadorEgyptEl SalvadorEnglandEritreaEthiopiaEuropeFijiFranceGermanyGhanaGreeceGrenadaGuatemalaGuyanaHaitiHondurasHong KongHungaryIndiaIndonesiaIranIraqIrelandIsraelItalyJamaicaJapanJordanKazakhstanKenyaKoreaKuwaitLaosLatin AmericaLatviaLebanonLiberiaLithuaniaMalaysiaMexicoMicronesiaMiddle AfricaMoldovaMoroccoNepalNetherlandsNicaraguaNigeriaNorth AmericaNorth MacedoniaNorthern AfricaNorthern EuropeNorwayOceaniaPakistanPanamaPeruPhilippinesPolandPortugalRomaniaRussiaSaudi ArabiaScotlandSenegalSerbiaSierra LeoneSingaporeSomaliaSouth AfricaSouth AmericaSouth Central AsiaSouth Eastern AsiaSouthern EuropeSpainSri LankaSt. Vincent and the GrenadinesSudanSwedenSwitzerlandSyriaTaiwanThailandTrinidad and TobagoTurkeyUgandaUkraineUruguayUzbekistanVenezuelaVietnamWest IndiesWestern AfricaWestern AsiaWestern EuropeYemenZaireZimbabweAzores
In Labor Force | Age 20-24
Income
Poverty
Unemployment
Labor Participation
Family Structure
Vehicle Availability
Education Level
Disability

In Labor Force | Age 20-24 Comparison

Immigrants from Belgium

Immigrants from Germany

Tragic
Exceptional
73.9%
IN LABOR FORCE | AGE 20-24
1.3/ 100
METRIC RATING
250th/ 347
METRIC RANK
76.2%
IN LABOR FORCE | AGE 20-24
98.5/ 100
METRIC RATING
95th/ 347
METRIC RANK

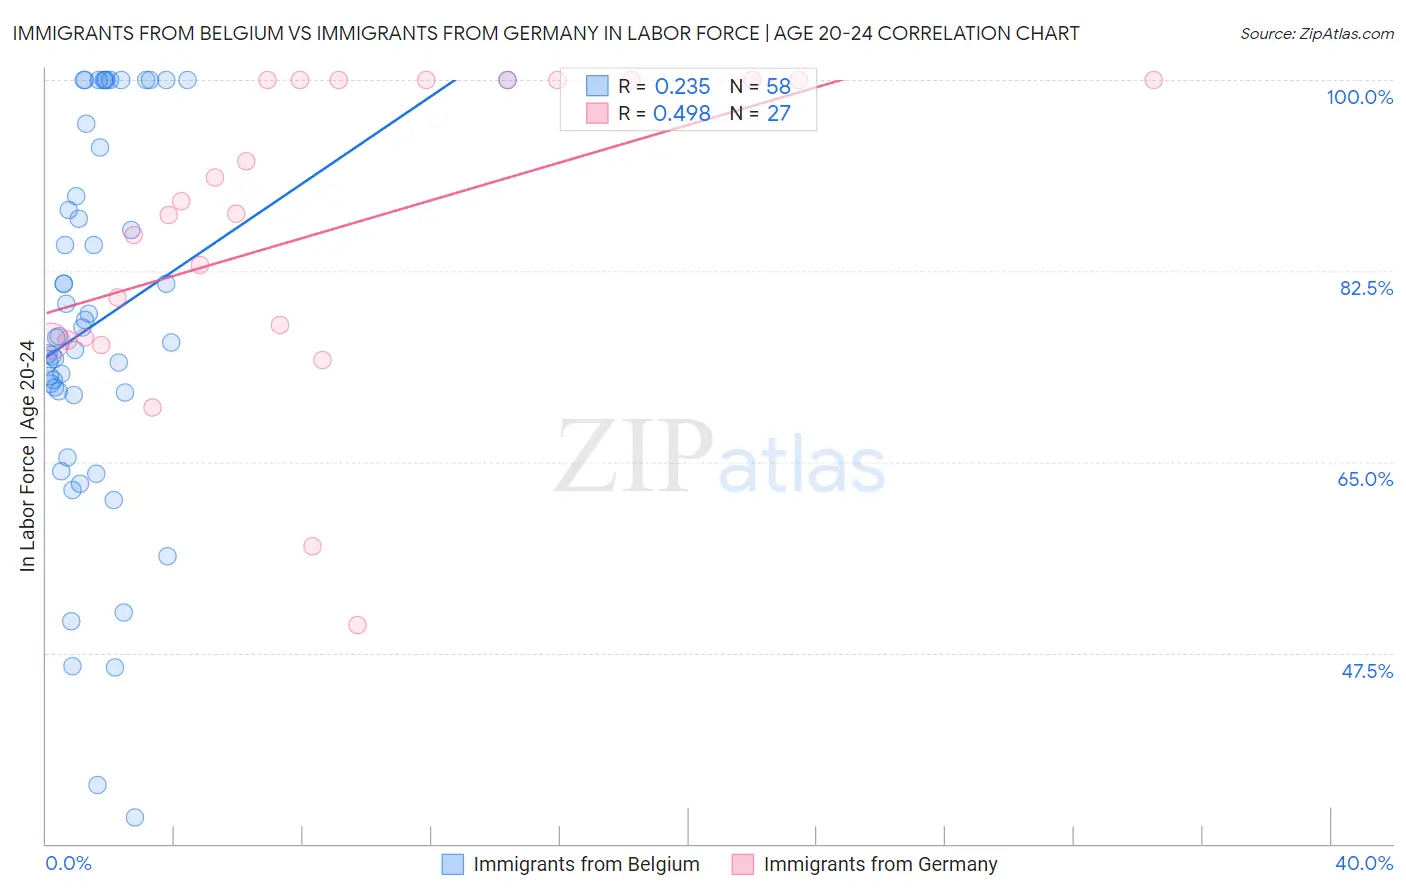
Immigrants from Belgium vs Immigrants from Germany In Labor Force | Age 20-24 Correlation Chart

The statistical analysis conducted on geographies consisting of 146,712,766 people shows a weak positive correlation between the proportion of Immigrants from Belgium and labor force participation rate among population between the ages 20 and 24 in the United States with a correlation coefficient (R) of 0.235 and weighted average of 73.9%. Similarly, the statistical analysis conducted on geographies consisting of 463,533,705 people shows a moderate positive correlation between the proportion of Immigrants from Germany and labor force participation rate among population between the ages 20 and 24 in the United States with a correlation coefficient (R) of 0.498 and weighted average of 76.2%, a difference of 3.2%.
Immigrants from Belgium vs Immigrants from Germany In Labor Force | Age 20-24

In Labor Force | Age 20-24 Correlation Summary

MeasurementImmigrants from BelgiumImmigrants from Germany
Minimum32.4%50.0%
Maximum100.0%100.0%
Range67.6%50.0%
Mean77.9%86.3%
Median76.4%87.8%
Interquartile 25% (IQ1)71.4%76.1%
Interquartile 75% (IQ3)93.8%100.0%
Interquartile Range (IQR)22.4%23.9%
Standard Deviation (Sample)17.2%14.0%
Standard Deviation (Population)17.1%13.7%

Similar Demographics by In Labor Force | Age 20-24

Demographics Similar to Immigrants from Belgium by In Labor Force | Age 20-24

In terms of in labor force | age 20-24, the demographic groups most similar to Immigrants from Belgium are Black/African American (73.9%, a difference of 0.0%), Immigrants from Egypt (73.8%, a difference of 0.020%), Immigrants from Kazakhstan (73.8%, a difference of 0.040%), Immigrants from Saudi Arabia (73.9%, a difference of 0.050%), and Colville (73.9%, a difference of 0.060%).
DemographicsRating | RankIn Labor Force | Age 20-24
Immigrants | Syria
1.9
/100
|
#243
Tragic
74.0%
Immigrants | South Central Asia
1.9
/100
|
#244
Tragic
74.0%
Turks
1.8
/100
|
#245
Tragic
73.9%
Immigrants | Panama
1.6
/100
|
#246
Tragic
73.9%
Colville
1.5
/100
|
#247
Tragic
73.9%
Immigrants | Saudi Arabia
1.5
/100
|
#248
Tragic
73.9%
Blacks/African Americans
1.3
/100
|
#249
Tragic
73.9%
Immigrants | Belgium
1.3
/100
|
#250
Tragic
73.9%
Immigrants | Egypt
1.2
/100
|
#251
Tragic
73.8%
Immigrants | Kazakhstan
1.1
/100
|
#252
Tragic
73.8%
Arapaho
1.0
/100
|
#253
Tragic
73.8%
Ute
1.0
/100
|
#254
Tragic
73.8%
Immigrants | Pakistan
0.9
/100
|
#255
Tragic
73.8%
Spanish American Indians
0.8
/100
|
#256
Tragic
73.7%
Paraguayans
0.8
/100
|
#257
Tragic
73.7%

Demographics Similar to Immigrants from Germany by In Labor Force | Age 20-24

In terms of in labor force | age 20-24, the demographic groups most similar to Immigrants from Germany are Potawatomi (76.2%, a difference of 0.0%), Nonimmigrants (76.2%, a difference of 0.010%), Hungarian (76.3%, a difference of 0.10%), Immigrants from Lithuania (76.1%, a difference of 0.11%), and Immigrants from Oceania (76.1%, a difference of 0.11%).
DemographicsRating | RankIn Labor Force | Age 20-24
Spanish
99.2
/100
|
#88
Exceptional
76.4%
Bulgarians
99.2
/100
|
#89
Exceptional
76.4%
Immigrants | Burma/Myanmar
99.1
/100
|
#90
Exceptional
76.3%
Sierra Leoneans
99.0
/100
|
#91
Exceptional
76.3%
Maltese
98.9
/100
|
#92
Exceptional
76.3%
Hungarians
98.9
/100
|
#93
Exceptional
76.3%
Potawatomi
98.5
/100
|
#94
Exceptional
76.2%
Immigrants | Germany
98.5
/100
|
#95
Exceptional
76.2%
Immigrants | Nonimmigrants
98.5
/100
|
#96
Exceptional
76.2%
Immigrants | Lithuania
98.0
/100
|
#97
Exceptional
76.1%
Immigrants | Oceania
98.0
/100
|
#98
Exceptional
76.1%
Americans
97.8
/100
|
#99
Exceptional
76.1%
Shoshone
97.8
/100
|
#100
Exceptional
76.1%
Immigrants | Poland
97.7
/100
|
#101
Exceptional
76.1%
Latvians
97.6
/100
|
#102
Exceptional
76.1%