Immigrants from Bangladesh vs Immigrants from Belarus In Labor Force | Age 20-64

COMPARE

Immigrants from Bangladesh
Race
Ancestry
AfghanAfricanAlaska NativeAlaskan AthabascanAlbanianAleutAlsatianAmericanApacheArabArapahoArgentineanArmenianAssyrian/Chaldean/SyriacAustralianAustrianBahamianBangladeshiBarbadianBasqueBelgianBelizeanBermudanBhutaneseBlackfeetBolivianBrazilianBritishBritish West IndianBulgarianBurmeseCajunCambodianCanadianCape VerdeanCarpatho RusynCelticCentral AmericanCentral American IndianCherokeeCheyenneChickasawChileanChineseChippewaChoctawColombianColvilleComancheCosta RicanCreeCreekCroatianCrowCubanCypriotCzechCzechoslovakianDanishDelawareDominicanDutchDutch West IndianEastern EuropeanEcuadorianEgyptianEnglishEstonianEthiopianEuropeanFijianFilipinoFinnishFrenchFrench American IndianFrench CanadianGermanGerman RussianGhanaianGreekGuamanian/ChamorroGuatemalanGuyaneseHaitianHmongHonduranHopiHoumaHungarianIcelanderIndian (Asian)IndonesianInupiatIranianIraqiIrishIroquoisIsraeliItalianJamaicanJapaneseJordanianKenyanKiowaKoreanLaotianLatvianLebaneseLiberianLithuanianLumbeeLuxembourgerMacedonianMalaysianMalteseMarshalleseMenomineeMexicanMexican American IndianMongolianMoroccanNative HawaiianNavajoNepaleseNew ZealanderNicaraguanNigerianNorthern EuropeanNorwegianOkinawanOsageOttawaPaiutePakistaniPalestinianPanamanianParaguayanPennsylvania GermanPeruvianPimaPolishPortuguesePotawatomiPuebloPuerto RicanPuget Sound SalishRomanianRussianSalvadoranSamoanScandinavianScotch-IrishScottishSeminoleSenegaleseSerbianShoshoneSierra LeoneanSiouxSlavicSlovakSloveneSomaliSouth AfricanSouth AmericanSouth American IndianSoviet UnionSpaniardSpanishSpanish AmericanSpanish American IndianSri LankanSubsaharan AfricanSudaneseSwedishSwissSyrianTaiwaneseThaiTlingit-HaidaTohono O'OdhamTonganTrinidadian and TobagonianTsimshianTurkishU.S. Virgin IslanderUgandanUkrainianUruguayanUteVenezuelanVietnameseWelshWest IndianYakamaYaquiYugoslavianYumanYup'ikZimbabwean
Immigration
NonimmigrantsImmigrantsAfghanistanAfricaAlbaniaArgentinaArmeniaAsiaAustraliaAustriaBahamasBangladeshBarbadosBelgiumBelizeBoliviaBosnia and HerzegovinaBrazilBulgariaBurma/MyanmarCabo VerdeCambodiaCameroonCanadaCaribbeanCentral AmericaChileChinaColombiaCongoCosta RicaCroatiaCubaCzechoslovakiaDenmarkDominicaDominican RepublicEastern AfricaEastern AsiaEastern EuropeEcuadorEgyptEl SalvadorEnglandEritreaEthiopiaEuropeFijiFranceGermanyGhanaGreeceGrenadaGuatemalaGuyanaHaitiHondurasHong KongHungaryIndiaIndonesiaIranIraqIrelandIsraelItalyJamaicaJapanJordanKazakhstanKenyaKoreaKuwaitLaosLatin AmericaLatviaLebanonLiberiaLithuaniaMalaysiaMexicoMicronesiaMiddle AfricaMoldovaMoroccoNepalNetherlandsNicaraguaNigeriaNorth AmericaNorth MacedoniaNorthern AfricaNorthern EuropeNorwayOceaniaPakistanPanamaPeruPhilippinesPolandPortugalRomaniaRussiaSaudi ArabiaScotlandSenegalSerbiaSierra LeoneSingaporeSomaliaSouth AfricaSouth AmericaSouth Central AsiaSouth Eastern AsiaSouthern EuropeSpainSri LankaSt. Vincent and the GrenadinesSudanSwedenSwitzerlandSyriaTaiwanThailandTrinidad and TobagoTurkeyUgandaUkraineUruguayUzbekistanVenezuelaVietnamWest IndiesWestern AfricaWestern AsiaWestern EuropeYemenZaireZimbabweAzores
Immigrants from Belarus
Race
Ancestry
AfghanAfricanAlaska NativeAlaskan AthabascanAlbanianAleutAlsatianAmericanApacheArabArapahoArgentineanArmenianAssyrian/Chaldean/SyriacAustralianAustrianBahamianBangladeshiBarbadianBasqueBelgianBelizeanBermudanBhutaneseBlackfeetBolivianBrazilianBritishBritish West IndianBulgarianBurmeseCajunCambodianCanadianCape VerdeanCarpatho RusynCelticCentral AmericanCentral American IndianCherokeeCheyenneChickasawChileanChineseChippewaChoctawColombianColvilleComancheCosta RicanCreeCreekCroatianCrowCubanCypriotCzechCzechoslovakianDanishDelawareDominicanDutchDutch West IndianEastern EuropeanEcuadorianEgyptianEnglishEstonianEthiopianEuropeanFijianFilipinoFinnishFrenchFrench American IndianFrench CanadianGermanGerman RussianGhanaianGreekGuamanian/ChamorroGuatemalanGuyaneseHaitianHmongHonduranHopiHoumaHungarianIcelanderIndian (Asian)IndonesianInupiatIranianIraqiIrishIroquoisIsraeliItalianJamaicanJapaneseJordanianKenyanKiowaKoreanLaotianLatvianLebaneseLiberianLithuanianLumbeeLuxembourgerMacedonianMalaysianMalteseMarshalleseMenomineeMexicanMexican American IndianMongolianMoroccanNative HawaiianNavajoNepaleseNew ZealanderNicaraguanNigerianNorthern EuropeanNorwegianOkinawanOsageOttawaPaiutePakistaniPalestinianPanamanianParaguayanPennsylvania GermanPeruvianPimaPolishPortuguesePotawatomiPuebloPuerto RicanPuget Sound SalishRomanianRussianSalvadoranSamoanScandinavianScotch-IrishScottishSeminoleSenegaleseSerbianShoshoneSierra LeoneanSiouxSlavicSlovakSloveneSomaliSouth AfricanSouth AmericanSouth American IndianSoviet UnionSpaniardSpanishSpanish AmericanSpanish American IndianSri LankanSubsaharan AfricanSudaneseSwedishSwissSyrianTaiwaneseThaiTlingit-HaidaTohono O'OdhamTonganTrinidadian and TobagonianTsimshianTurkishU.S. Virgin IslanderUgandanUkrainianUruguayanUteVenezuelanVietnameseWelshWest IndianYakamaYaquiYugoslavianYumanYup'ikZimbabwean
Immigration
NonimmigrantsImmigrantsAfghanistanAfricaAlbaniaArgentinaArmeniaAsiaAustraliaAustriaBahamasBarbadosBelarusBelgiumBelizeBoliviaBosnia and HerzegovinaBrazilBulgariaBurma/MyanmarCabo VerdeCambodiaCameroonCanadaCaribbeanCentral AmericaChileChinaColombiaCongoCosta RicaCroatiaCubaCzechoslovakiaDenmarkDominicaDominican RepublicEastern AfricaEastern AsiaEastern EuropeEcuadorEgyptEl SalvadorEnglandEritreaEthiopiaEuropeFijiFranceGermanyGhanaGreeceGrenadaGuatemalaGuyanaHaitiHondurasHong KongHungaryIndiaIndonesiaIranIraqIrelandIsraelItalyJamaicaJapanJordanKazakhstanKenyaKoreaKuwaitLaosLatin AmericaLatviaLebanonLiberiaLithuaniaMalaysiaMexicoMicronesiaMiddle AfricaMoldovaMoroccoNepalNetherlandsNicaraguaNigeriaNorth AmericaNorth MacedoniaNorthern AfricaNorthern EuropeNorwayOceaniaPakistanPanamaPeruPhilippinesPolandPortugalRomaniaRussiaSaudi ArabiaScotlandSenegalSerbiaSierra LeoneSingaporeSomaliaSouth AfricaSouth AmericaSouth Central AsiaSouth Eastern AsiaSouthern EuropeSpainSri LankaSt. Vincent and the GrenadinesSudanSwedenSwitzerlandSyriaTaiwanThailandTrinidad and TobagoTurkeyUgandaUkraineUruguayUzbekistanVenezuelaVietnamWest IndiesWestern AfricaWestern AsiaWestern EuropeYemenZaireZimbabweAzores
In Labor Force | Age 20-64
Income
Poverty
Unemployment
Labor Participation
Family Structure
Vehicle Availability
Education Level
Disability

In Labor Force | Age 20-64 Comparison

Immigrants from Bangladesh

Immigrants from Belarus

Tragic
Exceptional
77.9%
IN LABOR FORCE | AGE 20-64
0.0/ 100
METRIC RATING
290th/ 347
METRIC RANK
80.1%
IN LABOR FORCE | AGE 20-64
96.4/ 100
METRIC RATING
93rd/ 347
METRIC RANK

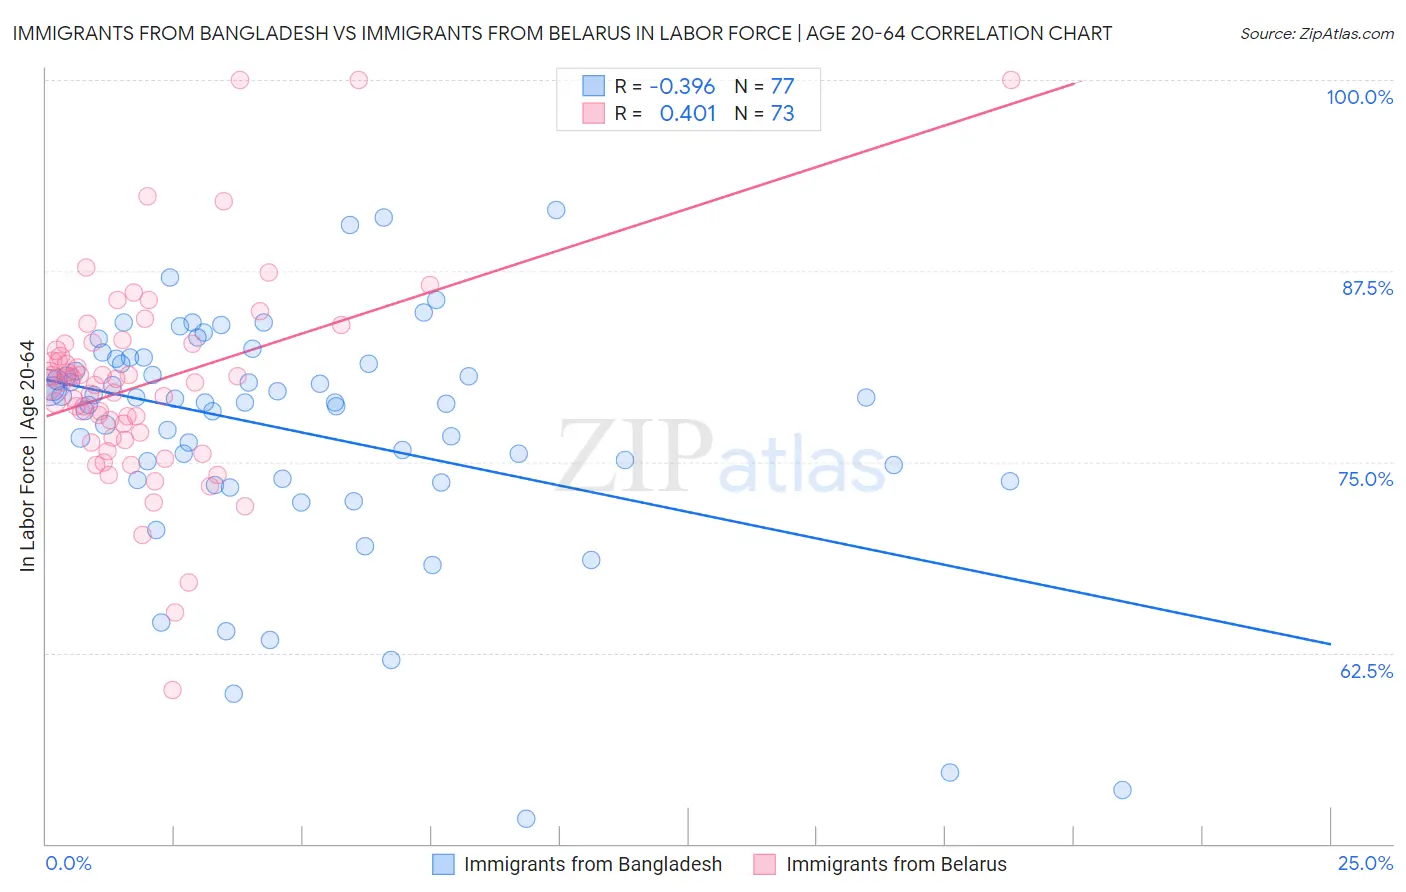
Immigrants from Bangladesh vs Immigrants from Belarus In Labor Force | Age 20-64 Correlation Chart

The statistical analysis conducted on geographies consisting of 203,682,121 people shows a mild negative correlation between the proportion of Immigrants from Bangladesh and labor force participation rate among population between the ages 20 and 64 in the United States with a correlation coefficient (R) of -0.396 and weighted average of 77.9%. Similarly, the statistical analysis conducted on geographies consisting of 150,198,984 people shows a moderate positive correlation between the proportion of Immigrants from Belarus and labor force participation rate among population between the ages 20 and 64 in the United States with a correlation coefficient (R) of 0.401 and weighted average of 80.1%, a difference of 2.8%.
Immigrants from Bangladesh vs Immigrants from Belarus In Labor Force | Age 20-64

In Labor Force | Age 20-64 Correlation Summary

MeasurementImmigrants from BangladeshImmigrants from Belarus
Minimum51.6%60.1%
Maximum91.5%100.0%
Range39.9%39.9%
Mean77.1%80.1%
Median78.9%80.2%
Interquartile 25% (IQ1)73.8%76.5%
Interquartile 75% (IQ3)81.6%82.7%
Interquartile Range (IQR)7.8%6.2%
Standard Deviation (Sample)7.8%6.7%
Standard Deviation (Population)7.8%6.7%

Similar Demographics by In Labor Force | Age 20-64

Demographics Similar to Immigrants from Bangladesh by In Labor Force | Age 20-64

In terms of in labor force | age 20-64, the demographic groups most similar to Immigrants from Bangladesh are African (77.9%, a difference of 0.010%), Hmong (77.9%, a difference of 0.020%), Spanish American (77.8%, a difference of 0.050%), Immigrants from Belize (78.0%, a difference of 0.10%), and Vietnamese (78.0%, a difference of 0.10%).
DemographicsRating | RankIn Labor Force | Age 20-64
Immigrants | Nonimmigrants
0.0
/100
|
#283
Tragic
78.1%
Immigrants | Guyana
0.0
/100
|
#284
Tragic
78.1%
Osage
0.0
/100
|
#285
Tragic
78.0%
Immigrants | Belize
0.0
/100
|
#286
Tragic
78.0%
Vietnamese
0.0
/100
|
#287
Tragic
78.0%
Hmong
0.0
/100
|
#288
Tragic
77.9%
Africans
0.0
/100
|
#289
Tragic
77.9%
Immigrants | Bangladesh
0.0
/100
|
#290
Tragic
77.9%
Spanish Americans
0.0
/100
|
#291
Tragic
77.8%
Immigrants | Azores
0.0
/100
|
#292
Tragic
77.8%
Delaware
0.0
/100
|
#293
Tragic
77.8%
Immigrants | Central America
0.0
/100
|
#294
Tragic
77.7%
Immigrants | Grenada
0.0
/100
|
#295
Tragic
77.7%
Immigrants | Dominican Republic
0.0
/100
|
#296
Tragic
77.7%
Dominicans
0.0
/100
|
#297
Tragic
77.7%

Demographics Similar to Immigrants from Belarus by In Labor Force | Age 20-64

In terms of in labor force | age 20-64, the demographic groups most similar to Immigrants from Belarus are Polish (80.1%, a difference of 0.020%), Uruguayan (80.1%, a difference of 0.020%), Ghanaian (80.1%, a difference of 0.020%), Immigrants from Asia (80.1%, a difference of 0.020%), and Yugoslavian (80.1%, a difference of 0.020%).
DemographicsRating | RankIn Labor Force | Age 20-64
Immigrants | Egypt
97.1
/100
|
#86
Exceptional
80.1%
Croatians
97.1
/100
|
#87
Exceptional
80.1%
Chileans
97.0
/100
|
#88
Exceptional
80.1%
Immigrants | Venezuela
96.8
/100
|
#89
Exceptional
80.1%
Poles
96.8
/100
|
#90
Exceptional
80.1%
Uruguayans
96.7
/100
|
#91
Exceptional
80.1%
Ghanaians
96.7
/100
|
#92
Exceptional
80.1%
Immigrants | Belarus
96.4
/100
|
#93
Exceptional
80.1%
Immigrants | Asia
96.0
/100
|
#94
Exceptional
80.1%
Yugoslavians
95.9
/100
|
#95
Exceptional
80.1%
Immigrants | Malaysia
95.9
/100
|
#96
Exceptional
80.1%
South Americans
95.9
/100
|
#97
Exceptional
80.1%
Immigrants | Uruguay
95.8
/100
|
#98
Exceptional
80.1%
Immigrants | Chile
95.7
/100
|
#99
Exceptional
80.1%
Filipinos
95.6
/100
|
#100
Exceptional
80.1%