Immigrants from the Azores vs Cree In Labor Force | Age 20-24

COMPARE

Immigrants from the Azores
Race
Ancestry
AfghanAfricanAlaska NativeAlaskan AthabascanAlbanianAleutAlsatianAmericanApacheArabArapahoArgentineanArmenianAssyrian/Chaldean/SyriacAustralianAustrianBahamianBangladeshiBarbadianBasqueBelgianBelizeanBermudanBhutaneseBlackfeetBolivianBrazilianBritishBritish West IndianBulgarianBurmeseCajunCambodianCanadianCape VerdeanCarpatho RusynCelticCentral AmericanCentral American IndianCherokeeCheyenneChickasawChileanChineseChippewaChoctawColombianColvilleComancheCosta RicanCreekCroatianCrowCubanCypriotCzechCzechoslovakianDanishDelawareDominicanDutchDutch West IndianEastern EuropeanEcuadorianEgyptianEnglishEstonianEthiopianEuropeanFijianFilipinoFinnishFrenchFrench American IndianFrench CanadianGermanGerman RussianGhanaianGreekGuamanian/ChamorroGuatemalanGuyaneseHaitianHmongHonduranHopiHoumaHungarianIcelanderIndian (Asian)IndonesianInupiatIranianIraqiIrishIroquoisIsraeliItalianJamaicanJapaneseJordanianKenyanKiowaKoreanLaotianLatvianLebaneseLiberianLithuanianLumbeeLuxembourgerMacedonianMalaysianMalteseMarshalleseMenomineeMexicanMexican American IndianMongolianMoroccanNative HawaiianNavajoNepaleseNew ZealanderNicaraguanNigerianNorthern EuropeanNorwegianOkinawanOsageOttawaPaiutePakistaniPalestinianPanamanianParaguayanPennsylvania GermanPeruvianPimaPolishPortuguesePotawatomiPuebloPuerto RicanPuget Sound SalishRomanianRussianSalvadoranSamoanScandinavianScotch-IrishScottishSeminoleSenegaleseSerbianShoshoneSierra LeoneanSiouxSlavicSlovakSloveneSomaliSouth AfricanSouth AmericanSouth American IndianSoviet UnionSpaniardSpanishSpanish AmericanSpanish American IndianSri LankanSubsaharan AfricanSudaneseSwedishSwissSyrianTaiwaneseThaiTlingit-HaidaTohono O'OdhamTonganTrinidadian and TobagonianTsimshianTurkishU.S. Virgin IslanderUgandanUkrainianUruguayanUteVenezuelanVietnameseWelshWest IndianYakamaYaquiYugoslavianYumanYup'ikZimbabwean
Immigration
NonimmigrantsImmigrantsAfghanistanAfricaAlbaniaArgentinaArmeniaAsiaAustraliaAustriaBahamasBangladeshBarbadosBelarusBelgiumBelizeBoliviaBosnia and HerzegovinaBrazilBulgariaBurma/MyanmarCabo VerdeCambodiaCameroonCanadaCaribbeanCentral AmericaChileChinaColombiaCongoCosta RicaCroatiaCubaCzechoslovakiaDenmarkDominicaDominican RepublicEastern AfricaEastern AsiaEastern EuropeEcuadorEgyptEl SalvadorEnglandEritreaEthiopiaEuropeFijiFranceGermanyGhanaGreeceGrenadaGuatemalaGuyanaHaitiHondurasHong KongHungaryIndiaIndonesiaIranIraqIrelandIsraelItalyJamaicaJapanJordanKazakhstanKenyaKoreaKuwaitLaosLatin AmericaLatviaLebanonLiberiaLithuaniaMalaysiaMexicoMicronesiaMiddle AfricaMoldovaMoroccoNepalNetherlandsNicaraguaNigeriaNorth AmericaNorth MacedoniaNorthern AfricaNorthern EuropeNorwayOceaniaPakistanPanamaPeruPhilippinesPolandPortugalRomaniaRussiaSaudi ArabiaScotlandSenegalSerbiaSierra LeoneSingaporeSomaliaSouth AfricaSouth AmericaSouth Central AsiaSouth Eastern AsiaSouthern EuropeSpainSri LankaSt. Vincent and the GrenadinesSudanSwedenSwitzerlandSyriaTaiwanThailandTrinidad and TobagoTurkeyUgandaUkraineUruguayUzbekistanVenezuelaVietnamWest IndiesWestern AfricaWestern AsiaWestern EuropeYemenZaireZimbabweAzores
Cree
Race
Ancestry
AfghanAfricanAlaska NativeAlaskan AthabascanAlbanianAleutAlsatianAmericanApacheArabArapahoArgentineanArmenianAssyrian/Chaldean/SyriacAustralianAustrianBahamianBangladeshiBarbadianBasqueBelgianBelizeanBermudanBhutaneseBlackfeetBolivianBrazilianBritishBritish West IndianBulgarianBurmeseCajunCambodianCanadianCape VerdeanCarpatho RusynCelticCentral AmericanCentral American IndianCherokeeCheyenneChickasawChileanChineseChippewaChoctawColombianColvilleComancheCosta RicanCreeCreekCroatianCrowCubanCypriotCzechCzechoslovakianDanishDelawareDominicanDutchDutch West IndianEastern EuropeanEcuadorianEgyptianEnglishEstonianEthiopianEuropeanFijianFilipinoFinnishFrenchFrench American IndianFrench CanadianGermanGerman RussianGhanaianGreekGuamanian/ChamorroGuatemalanGuyaneseHaitianHmongHonduranHopiHoumaHungarianIcelanderIndian (Asian)IndonesianInupiatIranianIraqiIrishIroquoisIsraeliItalianJamaicanJapaneseJordanianKenyanKiowaKoreanLaotianLatvianLebaneseLiberianLithuanianLumbeeLuxembourgerMacedonianMalaysianMalteseMarshalleseMenomineeMexicanMexican American IndianMongolianMoroccanNative HawaiianNavajoNepaleseNew ZealanderNicaraguanNigerianNorthern EuropeanNorwegianOkinawanOsageOttawaPaiutePakistaniPalestinianPanamanianParaguayanPennsylvania GermanPeruvianPimaPolishPortuguesePotawatomiPuebloPuerto RicanPuget Sound SalishRomanianRussianSalvadoranSamoanScandinavianScotch-IrishScottishSeminoleSenegaleseSerbianShoshoneSierra LeoneanSiouxSlavicSlovakSloveneSomaliSouth AfricanSouth AmericanSouth American IndianSoviet UnionSpaniardSpanishSpanish AmericanSpanish American IndianSri LankanSubsaharan AfricanSudaneseSwedishSwissSyrianTaiwaneseThaiTlingit-HaidaTohono O'OdhamTonganTrinidadian and TobagonianTsimshianTurkishU.S. Virgin IslanderUgandanUkrainianUruguayanUteVenezuelanVietnameseWelshWest IndianYakamaYaquiYugoslavianYumanYup'ikZimbabwean
Immigration
NonimmigrantsImmigrantsAfghanistanAfricaAlbaniaArgentinaArmeniaAsiaAustraliaAustriaBahamasBangladeshBarbadosBelarusBelgiumBelizeBoliviaBosnia and HerzegovinaBrazilBulgariaBurma/MyanmarCabo VerdeCambodiaCameroonCanadaCaribbeanCentral AmericaChileChinaColombiaCongoCosta RicaCroatiaCubaCzechoslovakiaDenmarkDominicaDominican RepublicEastern AfricaEastern AsiaEastern EuropeEcuadorEgyptEl SalvadorEnglandEritreaEthiopiaEuropeFijiFranceGermanyGhanaGreeceGrenadaGuatemalaGuyanaHaitiHondurasHong KongHungaryIndiaIndonesiaIranIraqIrelandIsraelItalyJamaicaJapanJordanKazakhstanKenyaKoreaKuwaitLaosLatin AmericaLatviaLebanonLiberiaLithuaniaMalaysiaMexicoMicronesiaMiddle AfricaMoldovaMoroccoNepalNetherlandsNicaraguaNigeriaNorth AmericaNorth MacedoniaNorthern AfricaNorthern EuropeNorwayOceaniaPakistanPanamaPeruPhilippinesPolandPortugalRomaniaRussiaSaudi ArabiaScotlandSenegalSerbiaSierra LeoneSingaporeSomaliaSouth AfricaSouth AmericaSouth Central AsiaSouth Eastern AsiaSouthern EuropeSpainSri LankaSt. Vincent and the GrenadinesSudanSwedenSwitzerlandSyriaTaiwanThailandTrinidad and TobagoTurkeyUgandaUkraineUruguayUzbekistanVenezuelaVietnamWest IndiesWestern AfricaWestern AsiaWestern EuropeYemenZaireZimbabwe
In Labor Force | Age 20-24
Income
Poverty
Unemployment
Labor Participation
Family Structure
Vehicle Availability
Education Level
Disability

In Labor Force | Age 20-24 Comparison

Immigrants from the Azores

Cree

Exceptional
Exceptional
77.2%
IN LABOR FORCE | AGE 20-24
100.0/ 100
METRIC RATING
53rd/ 347
METRIC RANK
76.6%
IN LABOR FORCE | AGE 20-24
99.7/ 100
METRIC RATING
74th/ 347
METRIC RANK

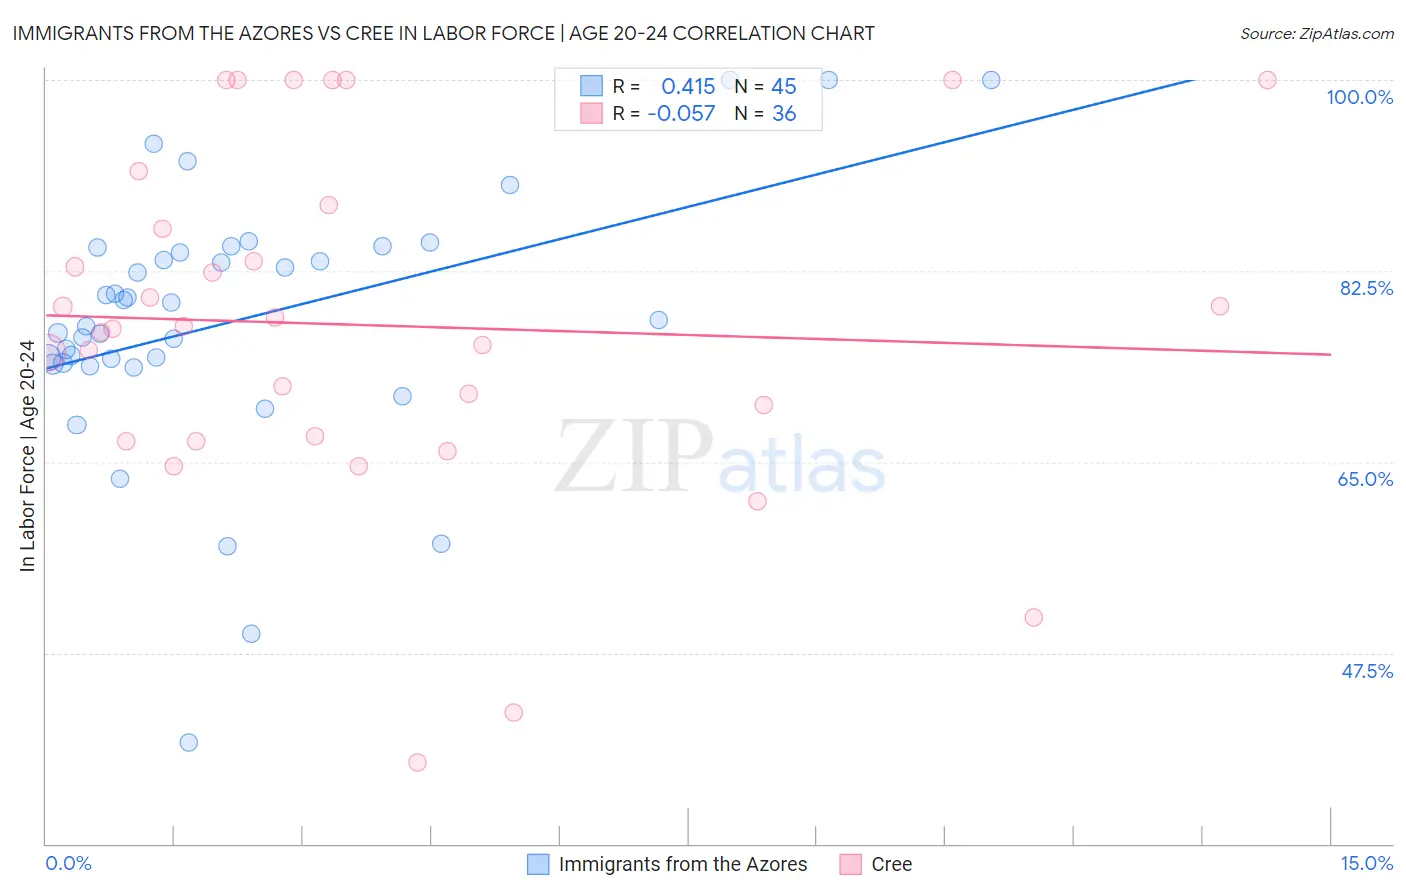
Immigrants from the Azores vs Cree In Labor Force | Age 20-24 Correlation Chart

The statistical analysis conducted on geographies consisting of 46,250,012 people shows a moderate positive correlation between the proportion of Immigrants from the Azores and labor force participation rate among population between the ages 20 and 24 in the United States with a correlation coefficient (R) of 0.415 and weighted average of 77.2%. Similarly, the statistical analysis conducted on geographies consisting of 76,182,817 people shows a slight negative correlation between the proportion of Cree and labor force participation rate among population between the ages 20 and 24 in the United States with a correlation coefficient (R) of -0.057 and weighted average of 76.6%, a difference of 0.73%.
Immigrants from the Azores vs Cree In Labor Force | Age 20-24

In Labor Force | Age 20-24 Correlation Summary

MeasurementImmigrants from the AzoresCree
Minimum39.3%37.5%
Maximum100.0%100.0%
Range60.7%62.5%
Mean78.0%77.5%
Median78.0%77.3%
Interquartile 25% (IQ1)74.0%67.1%
Interquartile 75% (IQ3)84.4%87.4%
Interquartile Range (IQR)10.4%20.4%
Standard Deviation (Sample)11.9%15.9%
Standard Deviation (Population)11.8%15.6%

Similar Demographics by In Labor Force | Age 20-24

Demographics Similar to Immigrants from the Azores by In Labor Force | Age 20-24

In terms of in labor force | age 20-24, the demographic groups most similar to Immigrants from the Azores are Indonesian (77.2%, a difference of 0.010%), Croatian (77.2%, a difference of 0.020%), Malaysian (77.2%, a difference of 0.030%), Chinese (77.3%, a difference of 0.070%), and Serbian (77.3%, a difference of 0.080%).
DemographicsRating | RankIn Labor Force | Age 20-24
Samoans
100.0
/100
|
#46
Exceptional
77.4%
Ethiopians
100.0
/100
|
#47
Exceptional
77.3%
Serbians
100.0
/100
|
#48
Exceptional
77.3%
Chinese
100.0
/100
|
#49
Exceptional
77.3%
Malaysians
100.0
/100
|
#50
Exceptional
77.2%
Croatians
100.0
/100
|
#51
Exceptional
77.2%
Indonesians
100.0
/100
|
#52
Exceptional
77.2%
Immigrants | Azores
100.0
/100
|
#53
Exceptional
77.2%
Celtics
99.9
/100
|
#54
Exceptional
77.1%
Immigrants | Liberia
99.9
/100
|
#55
Exceptional
77.1%
Europeans
99.9
/100
|
#56
Exceptional
77.1%
Chippewa
99.9
/100
|
#57
Exceptional
77.1%
Hawaiians
99.9
/100
|
#58
Exceptional
77.0%
Scotch-Irish
99.9
/100
|
#59
Exceptional
77.0%
Kenyans
99.9
/100
|
#60
Exceptional
77.0%

Demographics Similar to Cree by In Labor Force | Age 20-24

In terms of in labor force | age 20-24, the demographic groups most similar to Cree are Immigrants from Middle Africa (76.6%, a difference of 0.020%), Immigrants from Moldova (76.6%, a difference of 0.060%), British (76.7%, a difference of 0.070%), Immigrants from Cameroon (76.6%, a difference of 0.090%), and Canadian (76.6%, a difference of 0.090%).
DemographicsRating | RankIn Labor Force | Age 20-24
Slavs
99.9
/100
|
#67
Exceptional
76.9%
French American Indians
99.8
/100
|
#68
Exceptional
76.8%
Immigrants | Sudan
99.8
/100
|
#69
Exceptional
76.8%
Ottawa
99.8
/100
|
#70
Exceptional
76.8%
Northern Europeans
99.8
/100
|
#71
Exceptional
76.8%
Guamanians/Chamorros
99.8
/100
|
#72
Exceptional
76.7%
British
99.8
/100
|
#73
Exceptional
76.7%
Cree
99.7
/100
|
#74
Exceptional
76.6%
Immigrants | Middle Africa
99.7
/100
|
#75
Exceptional
76.6%
Immigrants | Moldova
99.6
/100
|
#76
Exceptional
76.6%
Immigrants | Cameroon
99.6
/100
|
#77
Exceptional
76.6%
Canadians
99.6
/100
|
#78
Exceptional
76.6%
Immigrants | Zaire
99.6
/100
|
#79
Exceptional
76.6%
Italians
99.6
/100
|
#80
Exceptional
76.5%
Basques
99.5
/100
|
#81
Exceptional
76.5%