Immigrants from Austria vs Tongan In Labor Force | Age 20-64
COMPARE
Immigrants from Austria
Tongan
In Labor Force | Age 20-64
In Labor Force | Age 20-64 Comparison
Immigrants from Austria
Tongans
79.4%
IN LABOR FORCE | AGE 20-64
23.7/ 100
METRIC RATING
195th/ 347
METRIC RANK
80.3%
IN LABOR FORCE | AGE 20-64
98.8/ 100
METRIC RATING
60th/ 347
METRIC RANK
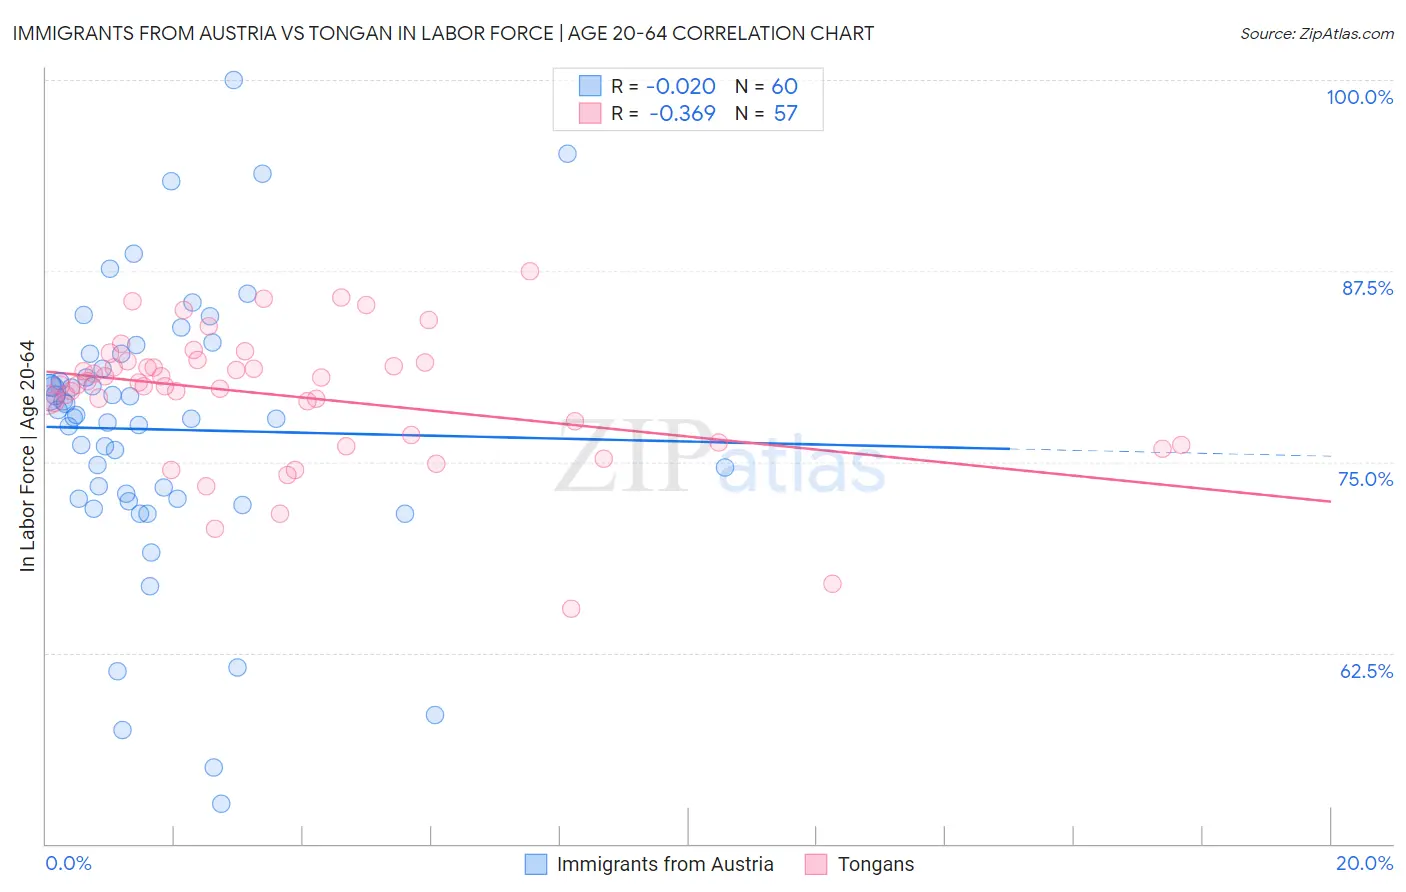
Immigrants from Austria vs Tongan In Labor Force | Age 20-64 Correlation Chart
The statistical analysis conducted on geographies consisting of 167,973,933 people shows no correlation between the proportion of Immigrants from Austria and labor force participation rate among population between the ages 20 and 64 in the United States with a correlation coefficient (R) of -0.020 and weighted average of 79.4%. Similarly, the statistical analysis conducted on geographies consisting of 102,905,644 people shows a mild negative correlation between the proportion of Tongans and labor force participation rate among population between the ages 20 and 64 in the United States with a correlation coefficient (R) of -0.369 and weighted average of 80.3%, a difference of 1.1%.
In Labor Force | Age 20-64 Correlation Summary
| Measurement | Immigrants from Austria | Tongan |
| Minimum | 52.6% | 65.4% |
| Maximum | 100.0% | 87.5% |
| Range | 47.4% | 22.1% |
| Mean | 77.1% | 79.3% |
| Median | 78.0% | 80.0% |
| Interquartile 25% (IQ1) | 72.6% | 76.5% |
| Interquartile 75% (IQ3) | 81.6% | 81.6% |
| Interquartile Range (IQR) | 9.0% | 5.0% |
| Standard Deviation (Sample) | 9.1% | 4.4% |
| Standard Deviation (Population) | 9.0% | 4.3% |
Similar Demographics by In Labor Force | Age 20-64
Demographics Similar to Immigrants from Austria by In Labor Force | Age 20-64
In terms of in labor force | age 20-64, the demographic groups most similar to Immigrants from Austria are Immigrants from Thailand (79.4%, a difference of 0.010%), Ecuadorian (79.4%, a difference of 0.010%), Immigrants from Senegal (79.4%, a difference of 0.010%), Immigrants from Denmark (79.4%, a difference of 0.030%), and Indonesian (79.4%, a difference of 0.030%).
| Demographics | Rating | Rank | In Labor Force | Age 20-64 |
| Immigrants | Haiti | 32.1 /100 | #188 | Fair 79.4% |
| Immigrants | El Salvador | 30.9 /100 | #189 | Fair 79.4% |
| Immigrants | Syria | 30.8 /100 | #190 | Fair 79.4% |
| Swiss | 28.9 /100 | #191 | Fair 79.4% |
| Immigrants | Denmark | 26.9 /100 | #192 | Fair 79.4% |
| Indonesians | 26.1 /100 | #193 | Fair 79.4% |
| Immigrants | Thailand | 24.8 /100 | #194 | Fair 79.4% |
| Immigrants | Austria | 23.7 /100 | #195 | Fair 79.4% |
| Ecuadorians | 23.1 /100 | #196 | Fair 79.4% |
| Immigrants | Senegal | 22.5 /100 | #197 | Fair 79.4% |
| Immigrants | Laos | 21.5 /100 | #198 | Fair 79.4% |
| Dutch | 20.2 /100 | #199 | Fair 79.3% |
| Immigrants | Oceania | 19.1 /100 | #200 | Poor 79.3% |
| Immigrants | Nicaragua | 19.0 /100 | #201 | Poor 79.3% |
| Nicaraguans | 18.3 /100 | #202 | Poor 79.3% |
Demographics Similar to Tongans by In Labor Force | Age 20-64
In terms of in labor force | age 20-64, the demographic groups most similar to Tongans are Swedish (80.3%, a difference of 0.0%), Burmese (80.3%, a difference of 0.0%), Carpatho Rusyn (80.3%, a difference of 0.0%), Serbian (80.3%, a difference of 0.010%), and Immigrants from Korea (80.3%, a difference of 0.010%).
| Demographics | Rating | Rank | In Labor Force | Age 20-64 |
| Immigrants | Peru | 99.2 /100 | #53 | Exceptional 80.3% |
| Peruvians | 99.1 /100 | #54 | Exceptional 80.3% |
| Immigrants | Cabo Verde | 99.0 /100 | #55 | Exceptional 80.3% |
| Immigrants | Northern Africa | 99.0 /100 | #56 | Exceptional 80.3% |
| Afghans | 98.9 /100 | #57 | Exceptional 80.3% |
| Serbians | 98.9 /100 | #58 | Exceptional 80.3% |
| Swedes | 98.9 /100 | #59 | Exceptional 80.3% |
| Tongans | 98.8 /100 | #60 | Exceptional 80.3% |
| Burmese | 98.8 /100 | #61 | Exceptional 80.3% |
| Carpatho Rusyns | 98.8 /100 | #62 | Exceptional 80.3% |
| Immigrants | Korea | 98.8 /100 | #63 | Exceptional 80.3% |
| Immigrants | Albania | 98.7 /100 | #64 | Exceptional 80.3% |
| Lithuanians | 98.7 /100 | #65 | Exceptional 80.2% |
| Macedonians | 98.7 /100 | #66 | Exceptional 80.2% |
| Taiwanese | 98.6 /100 | #67 | Exceptional 80.2% |