Immigrants from Austria vs Barbadian In Labor Force | Age 20-24

COMPARE

Immigrants from Austria
Race
Ancestry
AfghanAfricanAlaska NativeAlaskan AthabascanAlbanianAleutAlsatianAmericanApacheArabArapahoArgentineanArmenianAssyrian/Chaldean/SyriacAustralianAustrianBahamianBangladeshiBasqueBelgianBelizeanBermudanBhutaneseBlackfeetBolivianBrazilianBritishBritish West IndianBulgarianBurmeseCajunCambodianCanadianCape VerdeanCarpatho RusynCelticCentral AmericanCentral American IndianCherokeeCheyenneChickasawChileanChineseChippewaChoctawColombianColvilleComancheCosta RicanCreeCreekCroatianCrowCubanCypriotCzechCzechoslovakianDanishDelawareDominicanDutchDutch West IndianEastern EuropeanEcuadorianEgyptianEnglishEstonianEthiopianEuropeanFijianFilipinoFinnishFrenchFrench American IndianFrench CanadianGermanGerman RussianGhanaianGreekGuamanian/ChamorroGuatemalanGuyaneseHaitianHmongHonduranHopiHoumaHungarianIcelanderIndian (Asian)IndonesianInupiatIranianIraqiIrishIroquoisIsraeliItalianJamaicanJapaneseJordanianKenyanKiowaKoreanLaotianLatvianLebaneseLiberianLithuanianLumbeeLuxembourgerMacedonianMalaysianMalteseMarshalleseMenomineeMexicanMexican American IndianMongolianMoroccanNative HawaiianNavajoNepaleseNew ZealanderNicaraguanNigerianNorthern EuropeanNorwegianOkinawanOsageOttawaPaiutePakistaniPalestinianPanamanianParaguayanPennsylvania GermanPeruvianPimaPolishPortuguesePotawatomiPuebloPuerto RicanPuget Sound SalishRomanianRussianSalvadoranSamoanScandinavianScotch-IrishScottishSeminoleSenegaleseSerbianShoshoneSierra LeoneanSiouxSlavicSlovakSloveneSomaliSouth AfricanSouth AmericanSouth American IndianSoviet UnionSpaniardSpanishSpanish AmericanSpanish American IndianSri LankanSubsaharan AfricanSudaneseSwedishSwissSyrianTaiwaneseThaiTlingit-HaidaTohono O'OdhamTonganTrinidadian and TobagonianTsimshianTurkishU.S. Virgin IslanderUgandanUkrainianUruguayanUteVenezuelanVietnameseWelshWest IndianYakamaYaquiYugoslavianYumanYup'ikZimbabwean
Immigration
NonimmigrantsImmigrantsAfghanistanAfricaAlbaniaArgentinaArmeniaAsiaAustraliaAustriaBahamasBangladeshBarbadosBelarusBelgiumBelizeBoliviaBosnia and HerzegovinaBrazilBulgariaBurma/MyanmarCabo VerdeCambodiaCameroonCanadaCaribbeanCentral AmericaChileChinaColombiaCongoCosta RicaCroatiaCubaCzechoslovakiaDenmarkDominicaDominican RepublicEastern AfricaEastern AsiaEastern EuropeEcuadorEgyptEl SalvadorEnglandEritreaEthiopiaEuropeFijiFranceGermanyGhanaGreeceGrenadaGuatemalaGuyanaHaitiHondurasHong KongHungaryIndiaIndonesiaIranIraqIrelandIsraelItalyJamaicaJapanJordanKazakhstanKenyaKoreaKuwaitLaosLatin AmericaLatviaLebanonLiberiaLithuaniaMalaysiaMexicoMicronesiaMiddle AfricaMoldovaMoroccoNepalNetherlandsNicaraguaNigeriaNorth AmericaNorth MacedoniaNorthern AfricaNorthern EuropeNorwayOceaniaPakistanPanamaPeruPhilippinesPolandPortugalRomaniaRussiaSaudi ArabiaScotlandSenegalSerbiaSierra LeoneSingaporeSomaliaSouth AfricaSouth AmericaSouth Central AsiaSouth Eastern AsiaSouthern EuropeSpainSri LankaSt. Vincent and the GrenadinesSudanSwedenSwitzerlandSyriaTaiwanThailandTrinidad and TobagoTurkeyUgandaUkraineUruguayUzbekistanVenezuelaVietnamWest IndiesWestern AfricaWestern AsiaWestern EuropeYemenZaireZimbabweAzores
Barbadian
Race
Ancestry
AfghanAfricanAlaska NativeAlaskan AthabascanAlbanianAleutAlsatianAmericanApacheArabArapahoArgentineanArmenianAssyrian/Chaldean/SyriacAustralianAustrianBahamianBangladeshiBarbadianBasqueBelgianBelizeanBermudanBhutaneseBlackfeetBolivianBrazilianBritishBritish West IndianBulgarianBurmeseCajunCambodianCanadianCape VerdeanCarpatho RusynCelticCentral AmericanCentral American IndianCherokeeCheyenneChickasawChileanChineseChippewaChoctawColombianColvilleComancheCosta RicanCreeCreekCroatianCrowCubanCypriotCzechCzechoslovakianDanishDelawareDominicanDutchDutch West IndianEastern EuropeanEcuadorianEgyptianEnglishEstonianEthiopianEuropeanFijianFilipinoFinnishFrenchFrench American IndianFrench CanadianGermanGerman RussianGhanaianGreekGuamanian/ChamorroGuatemalanGuyaneseHaitianHmongHonduranHopiHoumaHungarianIcelanderIndian (Asian)IndonesianInupiatIranianIraqiIrishIroquoisIsraeliItalianJamaicanJapaneseJordanianKenyanKiowaKoreanLaotianLatvianLebaneseLiberianLithuanianLumbeeLuxembourgerMacedonianMalaysianMalteseMarshalleseMenomineeMexicanMexican American IndianMongolianMoroccanNative HawaiianNavajoNepaleseNew ZealanderNicaraguanNigerianNorthern EuropeanNorwegianOkinawanOsageOttawaPaiutePakistaniPalestinianPanamanianParaguayanPennsylvania GermanPeruvianPimaPolishPortuguesePotawatomiPuebloPuerto RicanPuget Sound SalishRomanianRussianSalvadoranSamoanScandinavianScotch-IrishScottishSeminoleSenegaleseSerbianShoshoneSierra LeoneanSiouxSlavicSlovakSloveneSomaliSouth AfricanSouth AmericanSouth American IndianSoviet UnionSpaniardSpanishSpanish AmericanSpanish American IndianSri LankanSubsaharan AfricanSudaneseSwedishSwissSyrianTaiwaneseThaiTlingit-HaidaTohono O'OdhamTonganTrinidadian and TobagonianTsimshianTurkishU.S. Virgin IslanderUgandanUkrainianUruguayanUteVenezuelanVietnameseWelshWest IndianYakamaYaquiYugoslavianYumanYup'ikZimbabwean
Immigration
NonimmigrantsImmigrantsAfghanistanAfricaAlbaniaArgentinaArmeniaAsiaAustraliaBahamasBangladeshBarbadosBelarusBelgiumBelizeBoliviaBosnia and HerzegovinaBrazilBulgariaBurma/MyanmarCabo VerdeCambodiaCameroonCanadaCaribbeanCentral AmericaChileChinaColombiaCongoCosta RicaCroatiaCubaCzechoslovakiaDenmarkDominicaDominican RepublicEastern AfricaEastern AsiaEastern EuropeEcuadorEgyptEl SalvadorEnglandEritreaEthiopiaEuropeFijiFranceGermanyGhanaGreeceGrenadaGuatemalaGuyanaHaitiHondurasHong KongHungaryIndiaIndonesiaIranIraqIrelandIsraelItalyJamaicaJapanJordanKazakhstanKenyaKoreaKuwaitLaosLatin AmericaLatviaLebanonLiberiaLithuaniaMalaysiaMexicoMicronesiaMiddle AfricaMoldovaMoroccoNepalNetherlandsNicaraguaNigeriaNorth AmericaNorth MacedoniaNorthern AfricaNorthern EuropeNorwayOceaniaPakistanPanamaPeruPhilippinesPolandPortugalRomaniaRussiaSaudi ArabiaScotlandSenegalSerbiaSierra LeoneSingaporeSomaliaSouth AfricaSouth AmericaSouth Central AsiaSouth Eastern AsiaSouthern EuropeSpainSri LankaSt. Vincent and the GrenadinesSudanSwedenSwitzerlandSyriaTaiwanThailandTrinidad and TobagoTurkeyUgandaUkraineUruguayUzbekistanVenezuelaVietnamWest IndiesWestern AfricaWestern AsiaWestern EuropeYemenZaireZimbabweAzores
In Labor Force | Age 20-24
Income
Poverty
Unemployment
Labor Participation
Family Structure
Vehicle Availability
Education Level
Disability

In Labor Force | Age 20-24 Comparison

Immigrants from Austria

Barbadians

Excellent
Tragic
75.6%
IN LABOR FORCE | AGE 20-24
88.8/ 100
METRIC RATING
130th/ 347
METRIC RANK
71.1%
IN LABOR FORCE | AGE 20-24
0.0/ 100
METRIC RATING
325th/ 347
METRIC RANK

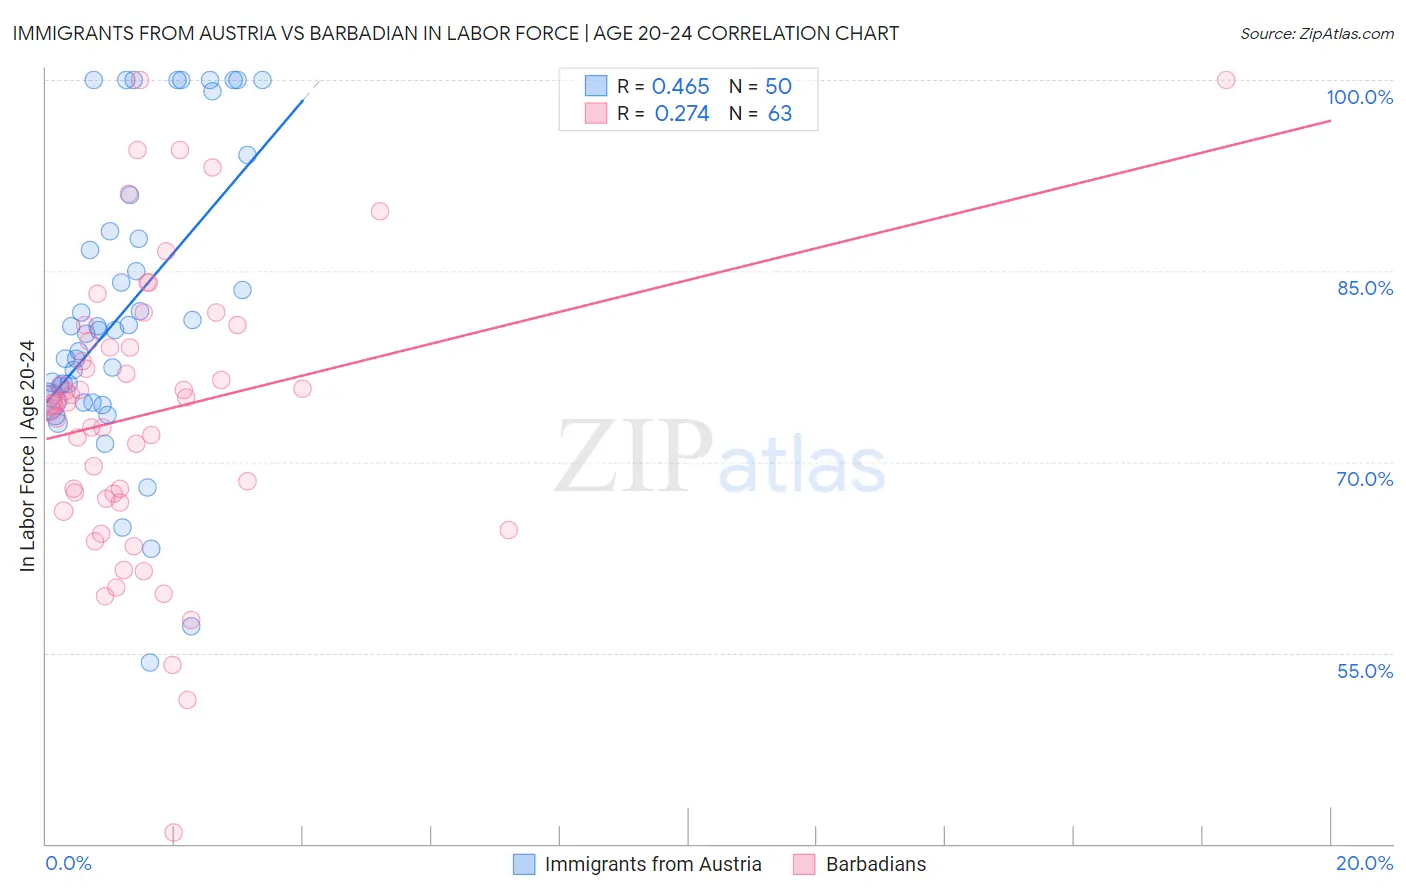
Immigrants from Austria vs Barbadian In Labor Force | Age 20-24 Correlation Chart

The statistical analysis conducted on geographies consisting of 167,871,666 people shows a moderate positive correlation between the proportion of Immigrants from Austria and labor force participation rate among population between the ages 20 and 24 in the United States with a correlation coefficient (R) of 0.465 and weighted average of 75.6%. Similarly, the statistical analysis conducted on geographies consisting of 141,301,120 people shows a weak positive correlation between the proportion of Barbadians and labor force participation rate among population between the ages 20 and 24 in the United States with a correlation coefficient (R) of 0.274 and weighted average of 71.1%, a difference of 6.3%.
Immigrants from Austria vs Barbadian In Labor Force | Age 20-24

In Labor Force | Age 20-24 Correlation Summary

MeasurementImmigrants from AustriaBarbadian
Minimum54.3%40.9%
Maximum100.0%100.0%
Range45.7%59.1%
Mean81.9%73.9%
Median80.3%74.7%
Interquartile 25% (IQ1)74.7%67.1%
Interquartile 75% (IQ3)88.1%79.5%
Interquartile Range (IQR)13.4%12.5%
Standard Deviation (Sample)11.6%11.3%
Standard Deviation (Population)11.5%11.2%

Similar Demographics by In Labor Force | Age 20-24

Demographics Similar to Immigrants from Austria by In Labor Force | Age 20-24

In terms of in labor force | age 20-24, the demographic groups most similar to Immigrants from Austria are Iroquois (75.6%, a difference of 0.010%), Immigrants from Jordan (75.6%, a difference of 0.010%), Palestinian (75.6%, a difference of 0.010%), Immigrants from Afghanistan (75.6%, a difference of 0.020%), and Zimbabwean (75.6%, a difference of 0.020%).
DemographicsRating | RankIn Labor Force | Age 20-24
Immigrants | Bulgaria
94.1
/100
|
#123
Exceptional
75.8%
Immigrants | Sierra Leone
93.8
/100
|
#124
Exceptional
75.8%
Immigrants | Scotland
93.7
/100
|
#125
Exceptional
75.8%
Brazilians
93.0
/100
|
#126
Exceptional
75.8%
Sub-Saharan Africans
90.9
/100
|
#127
Exceptional
75.7%
Immigrants | Afghanistan
89.4
/100
|
#128
Excellent
75.6%
Iroquois
89.1
/100
|
#129
Excellent
75.6%
Immigrants | Austria
88.8
/100
|
#130
Excellent
75.6%
Immigrants | Jordan
88.5
/100
|
#131
Excellent
75.6%
Palestinians
88.4
/100
|
#132
Excellent
75.6%
Zimbabweans
88.2
/100
|
#133
Excellent
75.6%
Estonians
87.1
/100
|
#134
Excellent
75.6%
Yaqui
85.5
/100
|
#135
Excellent
75.5%
Immigrants | Brazil
84.8
/100
|
#136
Excellent
75.5%
Jordanians
84.8
/100
|
#137
Excellent
75.5%

Demographics Similar to Barbadians by In Labor Force | Age 20-24

In terms of in labor force | age 20-24, the demographic groups most similar to Barbadians are Dominican (71.1%, a difference of 0.080%), Immigrants from Trinidad and Tobago (71.1%, a difference of 0.090%), Immigrants from China (71.1%, a difference of 0.10%), Immigrants from Dominican Republic (71.2%, a difference of 0.11%), and West Indian (71.3%, a difference of 0.20%).
DemographicsRating | RankIn Labor Force | Age 20-24
Immigrants | Hong Kong
0.0
/100
|
#318
Tragic
71.6%
Immigrants | Israel
0.0
/100
|
#319
Tragic
71.6%
Trinidadians and Tobagonians
0.0
/100
|
#320
Tragic
71.5%
Immigrants | Taiwan
0.0
/100
|
#321
Tragic
71.5%
Filipinos
0.0
/100
|
#322
Tragic
71.4%
West Indians
0.0
/100
|
#323
Tragic
71.3%
Immigrants | Dominican Republic
0.0
/100
|
#324
Tragic
71.2%
Barbadians
0.0
/100
|
#325
Tragic
71.1%
Dominicans
0.0
/100
|
#326
Tragic
71.1%
Immigrants | Trinidad and Tobago
0.0
/100
|
#327
Tragic
71.1%
Immigrants | China
0.0
/100
|
#328
Tragic
71.1%
Yup'ik
0.0
/100
|
#329
Tragic
70.9%
Vietnamese
0.0
/100
|
#330
Tragic
70.6%
Immigrants | Bangladesh
0.0
/100
|
#331
Tragic
70.6%
Immigrants | Uzbekistan
0.0
/100
|
#332
Tragic
70.4%