Immigrants from Asia vs Immigrants from Congo In Labor Force | Age 20-64

COMPARE

Immigrants from Asia
Race
Ancestry
AfghanAfricanAlaska NativeAlaskan AthabascanAlbanianAleutAlsatianAmericanApacheArabArapahoArgentineanArmenianAssyrian/Chaldean/SyriacAustralianAustrianBahamianBangladeshiBarbadianBasqueBelgianBelizeanBermudanBhutaneseBlackfeetBolivianBrazilianBritishBritish West IndianBulgarianBurmeseCajunCambodianCanadianCape VerdeanCarpatho RusynCelticCentral AmericanCentral American IndianCherokeeCheyenneChickasawChileanChineseChippewaChoctawColombianColvilleComancheCosta RicanCreeCreekCroatianCrowCubanCypriotCzechCzechoslovakianDanishDelawareDominicanDutchDutch West IndianEastern EuropeanEcuadorianEgyptianEnglishEstonianEthiopianEuropeanFijianFilipinoFinnishFrenchFrench American IndianFrench CanadianGermanGerman RussianGhanaianGreekGuamanian/ChamorroGuatemalanGuyaneseHaitianHmongHonduranHopiHoumaHungarianIcelanderIndian (Asian)IndonesianInupiatIranianIraqiIrishIroquoisIsraeliItalianJamaicanJapaneseJordanianKenyanKiowaKoreanLaotianLatvianLebaneseLiberianLithuanianLumbeeLuxembourgerMacedonianMalaysianMalteseMarshalleseMenomineeMexicanMexican American IndianMongolianMoroccanNative HawaiianNavajoNepaleseNew ZealanderNicaraguanNigerianNorthern EuropeanNorwegianOkinawanOsageOttawaPaiutePakistaniPalestinianPanamanianParaguayanPennsylvania GermanPeruvianPimaPolishPortuguesePotawatomiPuebloPuerto RicanPuget Sound SalishRomanianRussianSalvadoranSamoanScandinavianScotch-IrishScottishSeminoleSenegaleseSerbianShoshoneSierra LeoneanSiouxSlavicSlovakSloveneSomaliSouth AfricanSouth AmericanSouth American IndianSoviet UnionSpaniardSpanishSpanish AmericanSpanish American IndianSri LankanSubsaharan AfricanSudaneseSwedishSwissSyrianTaiwaneseThaiTlingit-HaidaTohono O'OdhamTonganTrinidadian and TobagonianTsimshianTurkishU.S. Virgin IslanderUgandanUkrainianUruguayanUteVenezuelanVietnameseWelshWest IndianYakamaYaquiYugoslavianYumanYup'ikZimbabwean
Immigration
NonimmigrantsImmigrantsAfghanistanAfricaAlbaniaArgentinaArmeniaAsiaAustraliaAustriaBahamasBangladeshBarbadosBelarusBelgiumBelizeBoliviaBosnia and HerzegovinaBrazilBulgariaBurma/MyanmarCabo VerdeCambodiaCameroonCanadaCaribbeanCentral AmericaChileChinaColombiaCosta RicaCroatiaCubaCzechoslovakiaDenmarkDominicaDominican RepublicEastern AfricaEastern AsiaEastern EuropeEcuadorEgyptEl SalvadorEnglandEritreaEthiopiaEuropeFijiFranceGermanyGhanaGreeceGrenadaGuatemalaGuyanaHaitiHondurasHong KongHungaryIndiaIndonesiaIranIraqIrelandIsraelItalyJamaicaJapanJordanKazakhstanKenyaKoreaKuwaitLaosLatin AmericaLatviaLebanonLiberiaLithuaniaMalaysiaMexicoMicronesiaMiddle AfricaMoldovaMoroccoNepalNetherlandsNicaraguaNigeriaNorth AmericaNorth MacedoniaNorthern AfricaNorthern EuropeNorwayOceaniaPakistanPanamaPeruPhilippinesPolandPortugalRomaniaRussiaSaudi ArabiaScotlandSenegalSerbiaSierra LeoneSingaporeSomaliaSouth AfricaSouth AmericaSouth Central AsiaSouth Eastern AsiaSouthern EuropeSpainSri LankaSt. Vincent and the GrenadinesSudanSwedenSwitzerlandSyriaTaiwanThailandTrinidad and TobagoTurkeyUgandaUkraineUruguayUzbekistanVenezuelaVietnamWest IndiesWestern AfricaWestern AsiaWestern EuropeYemenZaireZimbabweAzores
Immigrants from Congo
Race
Ancestry
AfghanAfricanAlaska NativeAlaskan AthabascanAlbanianAleutAlsatianAmericanApacheArabArapahoArgentineanArmenianAssyrian/Chaldean/SyriacAustralianAustrianBahamianBangladeshiBarbadianBasqueBelgianBelizeanBermudanBhutaneseBlackfeetBolivianBrazilianBritishBritish West IndianBulgarianBurmeseCajunCambodianCanadianCape VerdeanCarpatho RusynCelticCentral AmericanCentral American IndianCherokeeCheyenneChickasawChileanChineseChippewaChoctawColombianColvilleComancheCosta RicanCreeCreekCroatianCrowCubanCypriotCzechCzechoslovakianDanishDelawareDominicanDutchDutch West IndianEastern EuropeanEcuadorianEgyptianEnglishEstonianEthiopianEuropeanFijianFilipinoFinnishFrenchFrench American IndianFrench CanadianGermanGerman RussianGhanaianGreekGuamanian/ChamorroGuatemalanGuyaneseHaitianHmongHonduranHopiHoumaHungarianIcelanderIndian (Asian)IndonesianInupiatIranianIraqiIrishIroquoisIsraeliItalianJamaicanJapaneseJordanianKenyanKiowaKoreanLaotianLatvianLebaneseLiberianLithuanianLumbeeLuxembourgerMacedonianMalaysianMalteseMarshalleseMenomineeMexicanMexican American IndianMongolianMoroccanNative HawaiianNavajoNepaleseNew ZealanderNicaraguanNigerianNorthern EuropeanNorwegianOkinawanOsageOttawaPaiutePakistaniPalestinianPanamanianParaguayanPennsylvania GermanPeruvianPimaPolishPortuguesePotawatomiPuebloPuerto RicanPuget Sound SalishRomanianRussianSalvadoranSamoanScandinavianScotch-IrishScottishSeminoleSenegaleseSerbianShoshoneSierra LeoneanSiouxSlavicSlovakSloveneSomaliSouth AfricanSouth AmericanSouth American IndianSoviet UnionSpaniardSpanishSpanish AmericanSpanish American IndianSri LankanSubsaharan AfricanSudaneseSwedishSwissSyrianTaiwaneseThaiTlingit-HaidaTohono O'OdhamTonganTrinidadian and TobagonianTsimshianTurkishU.S. Virgin IslanderUgandanUkrainianUruguayanUteVenezuelanVietnameseWelshWest IndianYakamaYaquiYugoslavianYumanYup'ikZimbabwean
Immigration
NonimmigrantsImmigrantsAfghanistanAfricaAlbaniaArgentinaArmeniaAustraliaAustriaBahamasBangladeshBarbadosBelarusBelgiumBelizeBoliviaBosnia and HerzegovinaBrazilBulgariaBurma/MyanmarCabo VerdeCambodiaCameroonCanadaCaribbeanCentral AmericaChileChinaColombiaCongoCosta RicaCroatiaCubaCzechoslovakiaDenmarkDominicaDominican RepublicEastern AfricaEastern AsiaEastern EuropeEcuadorEgyptEl SalvadorEnglandEritreaEthiopiaEuropeFijiFranceGermanyGhanaGreeceGrenadaGuatemalaGuyanaHaitiHondurasHong KongHungaryIndiaIndonesiaIranIraqIrelandIsraelItalyJamaicaJapanJordanKazakhstanKenyaKoreaKuwaitLaosLatin AmericaLatviaLebanonLiberiaLithuaniaMalaysiaMexicoMicronesiaMiddle AfricaMoldovaMoroccoNepalNetherlandsNicaraguaNigeriaNorth AmericaNorth MacedoniaNorthern AfricaNorthern EuropeNorwayOceaniaPakistanPanamaPeruPhilippinesPolandPortugalRomaniaRussiaSaudi ArabiaScotlandSenegalSerbiaSierra LeoneSingaporeSomaliaSouth AfricaSouth AmericaSouth Central AsiaSouth Eastern AsiaSouthern EuropeSpainSri LankaSt. Vincent and the GrenadinesSudanSwedenSwitzerlandSyriaTaiwanThailandTrinidad and TobagoTurkeyUgandaUkraineUruguayUzbekistanVenezuelaVietnamWest IndiesWestern AfricaWestern AsiaWestern EuropeYemenZaireZimbabweAzores
In Labor Force | Age 20-64
Income
Poverty
Unemployment
Labor Participation
Family Structure
Vehicle Availability
Education Level
Disability

In Labor Force | Age 20-64 Comparison

Immigrants from Asia

Immigrants from Congo

Exceptional
Poor
80.1%
IN LABOR FORCE | AGE 20-64
96.0/ 100
METRIC RATING
94th/ 347
METRIC RANK
79.3%
IN LABOR FORCE | AGE 20-64
17.5/ 100
METRIC RATING
205th/ 347
METRIC RANK

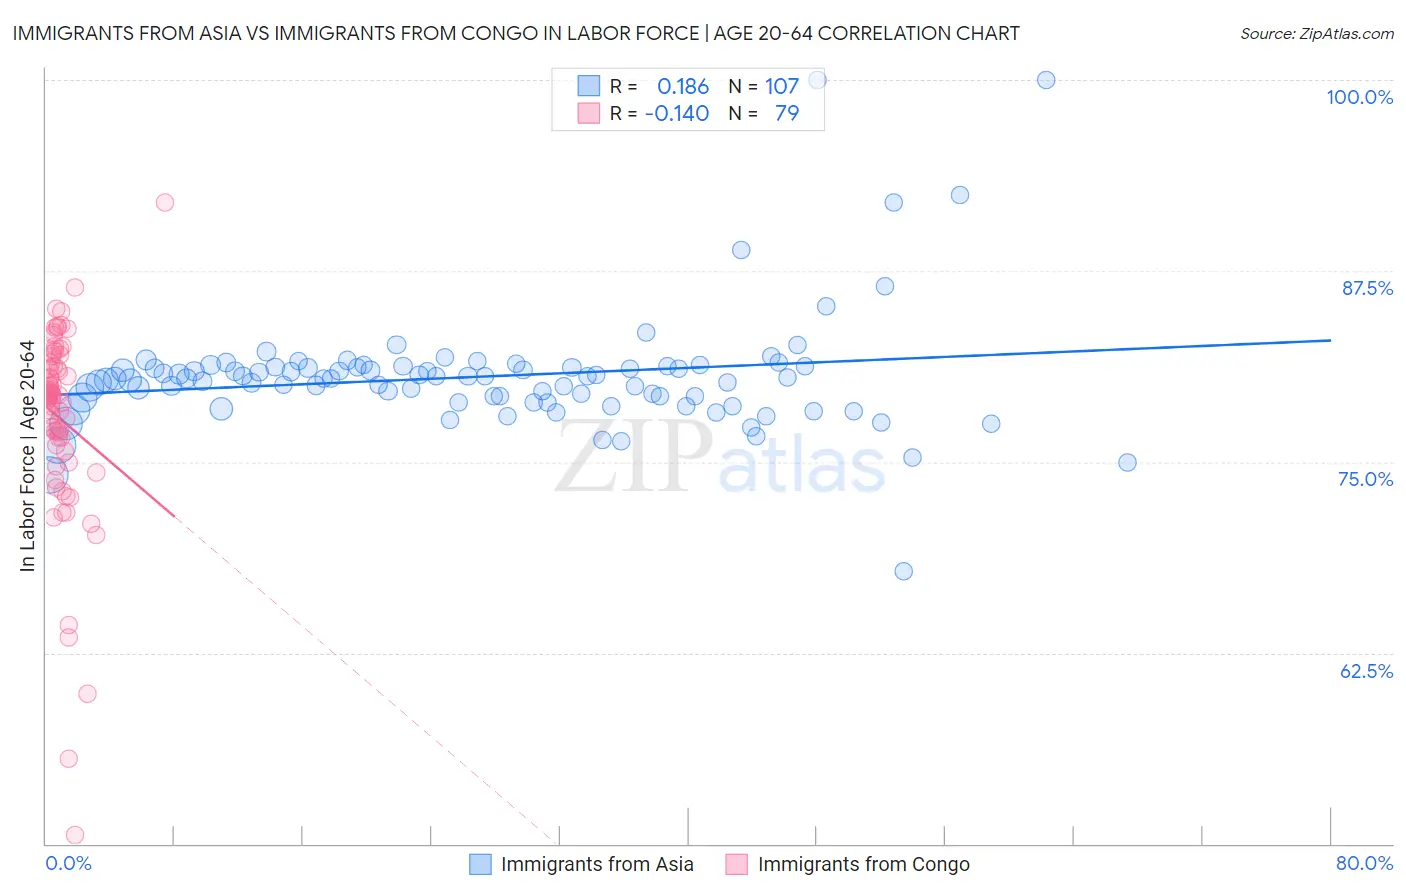
Immigrants from Asia vs Immigrants from Congo In Labor Force | Age 20-64 Correlation Chart

The statistical analysis conducted on geographies consisting of 549,180,709 people shows a poor positive correlation between the proportion of Immigrants from Asia and labor force participation rate among population between the ages 20 and 64 in the United States with a correlation coefficient (R) of 0.186 and weighted average of 80.1%. Similarly, the statistical analysis conducted on geographies consisting of 92,129,118 people shows a poor negative correlation between the proportion of Immigrants from Congo and labor force participation rate among population between the ages 20 and 64 in the United States with a correlation coefficient (R) of -0.140 and weighted average of 79.3%, a difference of 0.95%.
Immigrants from Asia vs Immigrants from Congo In Labor Force | Age 20-64

In Labor Force | Age 20-64 Correlation Summary

MeasurementImmigrants from AsiaImmigrants from Congo
Minimum67.8%50.6%
Maximum100.0%92.0%
Range32.2%41.4%
Mean80.6%77.8%
Median80.5%79.3%
Interquartile 25% (IQ1)78.9%76.1%
Interquartile 75% (IQ3)81.2%81.5%
Interquartile Range (IQR)2.3%5.4%
Standard Deviation (Sample)3.9%6.4%
Standard Deviation (Population)3.9%6.4%

Similar Demographics by In Labor Force | Age 20-64

Demographics Similar to Immigrants from Asia by In Labor Force | Age 20-64

In terms of in labor force | age 20-64, the demographic groups most similar to Immigrants from Asia are Yugoslavian (80.1%, a difference of 0.010%), Immigrants from Malaysia (80.1%, a difference of 0.010%), South American (80.1%, a difference of 0.010%), Immigrants from Uruguay (80.1%, a difference of 0.010%), and Immigrants from Belarus (80.1%, a difference of 0.020%).
DemographicsRating | RankIn Labor Force | Age 20-64
Croatians
97.1
/100
|
#87
Exceptional
80.1%
Chileans
97.0
/100
|
#88
Exceptional
80.1%
Immigrants | Venezuela
96.8
/100
|
#89
Exceptional
80.1%
Poles
96.8
/100
|
#90
Exceptional
80.1%
Uruguayans
96.7
/100
|
#91
Exceptional
80.1%
Ghanaians
96.7
/100
|
#92
Exceptional
80.1%
Immigrants | Belarus
96.4
/100
|
#93
Exceptional
80.1%
Immigrants | Asia
96.0
/100
|
#94
Exceptional
80.1%
Yugoslavians
95.9
/100
|
#95
Exceptional
80.1%
Immigrants | Malaysia
95.9
/100
|
#96
Exceptional
80.1%
South Americans
95.9
/100
|
#97
Exceptional
80.1%
Immigrants | Uruguay
95.8
/100
|
#98
Exceptional
80.1%
Immigrants | Chile
95.7
/100
|
#99
Exceptional
80.1%
Filipinos
95.6
/100
|
#100
Exceptional
80.1%
Palestinians
95.5
/100
|
#101
Exceptional
80.0%

Demographics Similar to Immigrants from Congo by In Labor Force | Age 20-64

In terms of in labor force | age 20-64, the demographic groups most similar to Immigrants from Congo are Iraqi (79.3%, a difference of 0.0%), Immigrants from Cambodia (79.3%, a difference of 0.0%), Nicaraguan (79.3%, a difference of 0.010%), Immigrants from Ecuador (79.3%, a difference of 0.010%), and Subsaharan African (79.3%, a difference of 0.010%).
DemographicsRating | RankIn Labor Force | Age 20-64
Immigrants | Laos
21.5
/100
|
#198
Fair
79.4%
Dutch
20.2
/100
|
#199
Fair
79.3%
Immigrants | Oceania
19.1
/100
|
#200
Poor
79.3%
Immigrants | Nicaragua
19.0
/100
|
#201
Poor
79.3%
Nicaraguans
18.3
/100
|
#202
Poor
79.3%
Iraqis
17.7
/100
|
#203
Poor
79.3%
Immigrants | Cambodia
17.6
/100
|
#204
Poor
79.3%
Immigrants | Congo
17.5
/100
|
#205
Poor
79.3%
Immigrants | Ecuador
16.9
/100
|
#206
Poor
79.3%
Sub-Saharan Africans
16.5
/100
|
#207
Poor
79.3%
British
16.5
/100
|
#208
Poor
79.3%
Bangladeshis
16.4
/100
|
#209
Poor
79.3%
Haitians
16.1
/100
|
#210
Poor
79.3%
Europeans
15.3
/100
|
#211
Poor
79.3%
Irish
13.2
/100
|
#212
Poor
79.3%