Immigrants from Argentina vs Venezuelan In Labor Force | Age 45-54
COMPARE
Immigrants from Argentina
Venezuelan
In Labor Force | Age 45-54
In Labor Force | Age 45-54 Comparison
Immigrants from Argentina
Venezuelans
83.3%
IN LABOR FORCE | AGE 45-54
94.9/ 100
METRIC RATING
95th/ 347
METRIC RANK
83.6%
IN LABOR FORCE | AGE 45-54
99.2/ 100
METRIC RATING
43rd/ 347
METRIC RANK
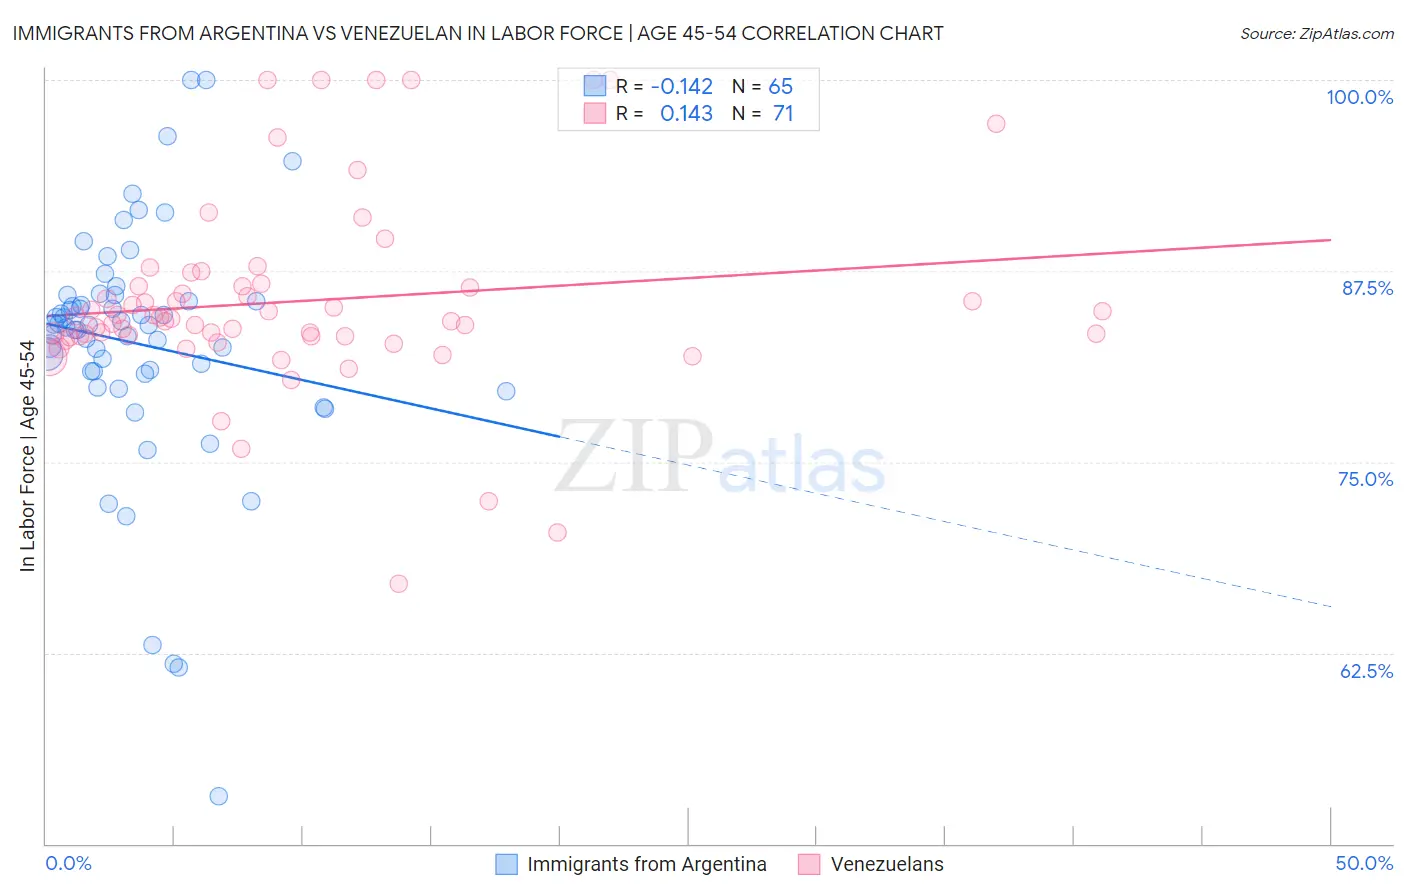
Immigrants from Argentina vs Venezuelan In Labor Force | Age 45-54 Correlation Chart
The statistical analysis conducted on geographies consisting of 264,349,552 people shows a poor negative correlation between the proportion of Immigrants from Argentina and labor force participation rate among population between the ages 45 and 54 in the United States with a correlation coefficient (R) of -0.142 and weighted average of 83.3%. Similarly, the statistical analysis conducted on geographies consisting of 306,136,855 people shows a poor positive correlation between the proportion of Venezuelans and labor force participation rate among population between the ages 45 and 54 in the United States with a correlation coefficient (R) of 0.143 and weighted average of 83.6%, a difference of 0.41%.
In Labor Force | Age 45-54 Correlation Summary
| Measurement | Immigrants from Argentina | Venezuelan |
| Minimum | 53.1% | 67.0% |
| Maximum | 100.0% | 100.0% |
| Range | 46.9% | 33.0% |
| Mean | 82.7% | 85.5% |
| Median | 83.9% | 84.4% |
| Interquartile 25% (IQ1) | 80.8% | 83.2% |
| Interquartile 75% (IQ3) | 85.7% | 86.5% |
| Interquartile Range (IQR) | 4.9% | 3.3% |
| Standard Deviation (Sample) | 8.1% | 6.3% |
| Standard Deviation (Population) | 8.0% | 6.3% |
Similar Demographics by In Labor Force | Age 45-54
Demographics Similar to Immigrants from Argentina by In Labor Force | Age 45-54
In terms of in labor force | age 45-54, the demographic groups most similar to Immigrants from Argentina are Argentinean (83.3%, a difference of 0.0%), Immigrants from Kuwait (83.3%, a difference of 0.0%), Palestinian (83.3%, a difference of 0.0%), Italian (83.3%, a difference of 0.010%), and Danish (83.3%, a difference of 0.020%).
| Demographics | Rating | Rank | In Labor Force | Age 45-54 |
| Immigrants | Asia | 95.6 /100 | #88 | Exceptional 83.3% |
| Indians (Asian) | 95.5 /100 | #89 | Exceptional 83.3% |
| Immigrants | Japan | 95.5 /100 | #90 | Exceptional 83.3% |
| South Americans | 95.5 /100 | #91 | Exceptional 83.3% |
| Danes | 95.3 /100 | #92 | Exceptional 83.3% |
| Italians | 95.1 /100 | #93 | Exceptional 83.3% |
| Argentineans | 94.9 /100 | #94 | Exceptional 83.3% |
| Immigrants | Argentina | 94.9 /100 | #95 | Exceptional 83.3% |
| Immigrants | Kuwait | 94.8 /100 | #96 | Exceptional 83.3% |
| Palestinians | 94.8 /100 | #97 | Exceptional 83.3% |
| Maltese | 94.4 /100 | #98 | Exceptional 83.3% |
| Immigrants | Middle Africa | 94.3 /100 | #99 | Exceptional 83.3% |
| Mongolians | 94.2 /100 | #100 | Exceptional 83.3% |
| Immigrants | Belarus | 94.1 /100 | #101 | Exceptional 83.3% |
| Immigrants | Singapore | 93.9 /100 | #102 | Exceptional 83.3% |
Demographics Similar to Venezuelans by In Labor Force | Age 45-54
In terms of in labor force | age 45-54, the demographic groups most similar to Venezuelans are Burmese (83.6%, a difference of 0.020%), Immigrants from Hong Kong (83.6%, a difference of 0.020%), Lithuanian (83.6%, a difference of 0.030%), Croatian (83.6%, a difference of 0.040%), and Immigrants from Uganda (83.7%, a difference of 0.050%).
| Demographics | Rating | Rank | In Labor Force | Age 45-54 |
| Ugandans | 99.5 /100 | #36 | Exceptional 83.7% |
| Swedes | 99.4 /100 | #37 | Exceptional 83.7% |
| Immigrants | Venezuela | 99.4 /100 | #38 | Exceptional 83.7% |
| Immigrants | Cuba | 99.4 /100 | #39 | Exceptional 83.7% |
| Immigrants | Uganda | 99.4 /100 | #40 | Exceptional 83.7% |
| Immigrants | Korea | 99.3 /100 | #41 | Exceptional 83.7% |
| Immigrants | Moldova | 99.3 /100 | #42 | Exceptional 83.7% |
| Venezuelans | 99.2 /100 | #43 | Exceptional 83.6% |
| Burmese | 99.1 /100 | #44 | Exceptional 83.6% |
| Immigrants | Hong Kong | 99.1 /100 | #45 | Exceptional 83.6% |
| Lithuanians | 99.1 /100 | #46 | Exceptional 83.6% |
| Croatians | 99.0 /100 | #47 | Exceptional 83.6% |
| Immigrants | Poland | 99.0 /100 | #48 | Exceptional 83.6% |
| Immigrants | Morocco | 99.0 /100 | #49 | Exceptional 83.6% |
| Immigrants | Greece | 98.8 /100 | #50 | Exceptional 83.6% |