Immigrants from Albania vs Zimbabwean In Labor Force | Age 20-64

COMPARE

Immigrants from Albania
Race
Ancestry
AfghanAfricanAlaska NativeAlaskan AthabascanAlbanianAleutAlsatianAmericanApacheArabArapahoArgentineanArmenianAssyrian/Chaldean/SyriacAustralianAustrianBahamianBangladeshiBarbadianBasqueBelgianBelizeanBermudanBhutaneseBlackfeetBolivianBrazilianBritishBritish West IndianBulgarianBurmeseCajunCambodianCanadianCape VerdeanCarpatho RusynCelticCentral AmericanCentral American IndianCherokeeCheyenneChickasawChileanChineseChippewaChoctawColombianColvilleComancheCosta RicanCreeCreekCroatianCrowCubanCypriotCzechCzechoslovakianDanishDelawareDominicanDutchDutch West IndianEastern EuropeanEcuadorianEgyptianEnglishEstonianEthiopianEuropeanFijianFilipinoFinnishFrenchFrench American IndianFrench CanadianGermanGerman RussianGhanaianGreekGuamanian/ChamorroGuatemalanGuyaneseHaitianHmongHonduranHopiHoumaHungarianIcelanderIndian (Asian)IndonesianInupiatIranianIraqiIrishIroquoisIsraeliItalianJamaicanJapaneseJordanianKenyanKiowaKoreanLaotianLatvianLebaneseLiberianLithuanianLumbeeLuxembourgerMacedonianMalaysianMalteseMarshalleseMenomineeMexicanMexican American IndianMongolianMoroccanNative HawaiianNavajoNepaleseNew ZealanderNicaraguanNigerianNorthern EuropeanNorwegianOkinawanOsageOttawaPaiutePakistaniPalestinianPanamanianParaguayanPennsylvania GermanPeruvianPimaPolishPortuguesePotawatomiPuebloPuerto RicanPuget Sound SalishRomanianRussianSalvadoranSamoanScandinavianScotch-IrishScottishSeminoleSenegaleseSerbianShoshoneSierra LeoneanSiouxSlavicSlovakSloveneSomaliSouth AfricanSouth AmericanSouth American IndianSoviet UnionSpaniardSpanishSpanish AmericanSpanish American IndianSri LankanSubsaharan AfricanSudaneseSwedishSwissSyrianTaiwaneseThaiTlingit-HaidaTohono O'OdhamTonganTrinidadian and TobagonianTsimshianTurkishU.S. Virgin IslanderUgandanUkrainianUruguayanUteVenezuelanVietnameseWelshWest IndianYakamaYaquiYugoslavianYumanYup'ik
Immigration
NonimmigrantsImmigrantsAfghanistanAfricaAlbaniaArgentinaArmeniaAsiaAustraliaAustriaBahamasBangladeshBarbadosBelarusBelgiumBelizeBoliviaBosnia and HerzegovinaBrazilBulgariaBurma/MyanmarCabo VerdeCambodiaCameroonCanadaCaribbeanCentral AmericaChileChinaColombiaCongoCosta RicaCroatiaCubaCzechoslovakiaDenmarkDominicaDominican RepublicEastern AfricaEastern AsiaEastern EuropeEcuadorEgyptEl SalvadorEnglandEritreaEthiopiaEuropeFijiFranceGermanyGhanaGreeceGrenadaGuatemalaGuyanaHaitiHondurasHong KongHungaryIndiaIndonesiaIranIraqIrelandIsraelItalyJamaicaJapanJordanKazakhstanKenyaKoreaKuwaitLaosLatin AmericaLatviaLebanonLiberiaLithuaniaMalaysiaMexicoMicronesiaMiddle AfricaMoldovaMoroccoNepalNetherlandsNicaraguaNigeriaNorth AmericaNorth MacedoniaNorthern AfricaNorthern EuropeNorwayOceaniaPakistanPanamaPeruPhilippinesPolandPortugalRomaniaRussiaSaudi ArabiaScotlandSenegalSerbiaSierra LeoneSingaporeSomaliaSouth AfricaSouth AmericaSouth Central AsiaSouth Eastern AsiaSouthern EuropeSpainSri LankaSt. Vincent and the GrenadinesSudanSwedenSwitzerlandSyriaTaiwanThailandTrinidad and TobagoTurkeyUgandaUkraineUruguayUzbekistanVenezuelaVietnamWest IndiesWestern AfricaWestern AsiaWestern EuropeYemenZaireZimbabweAzores
Zimbabwean
Race
Ancestry
AfghanAfricanAlaska NativeAlaskan AthabascanAlbanianAleutAlsatianAmericanApacheArabArapahoArgentineanArmenianAssyrian/Chaldean/SyriacAustralianAustrianBahamianBangladeshiBarbadianBasqueBelgianBelizeanBermudanBhutaneseBlackfeetBolivianBrazilianBritishBritish West IndianBulgarianBurmeseCajunCambodianCanadianCape VerdeanCarpatho RusynCelticCentral AmericanCentral American IndianCherokeeCheyenneChickasawChileanChineseChippewaChoctawColombianColvilleComancheCosta RicanCreeCreekCroatianCrowCubanCypriotCzechCzechoslovakianDanishDelawareDominicanDutchDutch West IndianEastern EuropeanEcuadorianEgyptianEnglishEstonianEthiopianEuropeanFijianFilipinoFinnishFrenchFrench American IndianFrench CanadianGermanGerman RussianGhanaianGreekGuamanian/ChamorroGuatemalanGuyaneseHaitianHmongHonduranHopiHoumaHungarianIcelanderIndian (Asian)IndonesianInupiatIranianIraqiIrishIroquoisIsraeliItalianJamaicanJapaneseJordanianKenyanKiowaKoreanLaotianLatvianLebaneseLiberianLithuanianLumbeeLuxembourgerMacedonianMalaysianMalteseMarshalleseMenomineeMexicanMexican American IndianMongolianMoroccanNative HawaiianNavajoNepaleseNew ZealanderNicaraguanNigerianNorthern EuropeanNorwegianOkinawanOsageOttawaPaiutePakistaniPalestinianPanamanianParaguayanPennsylvania GermanPeruvianPimaPolishPortuguesePotawatomiPuebloPuerto RicanPuget Sound SalishRomanianRussianSalvadoranSamoanScandinavianScotch-IrishScottishSeminoleSenegaleseSerbianShoshoneSierra LeoneanSiouxSlavicSlovakSloveneSomaliSouth AfricanSouth AmericanSouth American IndianSoviet UnionSpaniardSpanishSpanish AmericanSpanish American IndianSri LankanSubsaharan AfricanSudaneseSwedishSwissSyrianTaiwaneseThaiTlingit-HaidaTohono O'OdhamTonganTrinidadian and TobagonianTsimshianTurkishU.S. Virgin IslanderUgandanUkrainianUruguayanUteVenezuelanVietnameseWelshWest IndianYakamaYaquiYugoslavianYumanYup'ikZimbabwean
Immigration
NonimmigrantsImmigrantsAfghanistanAfricaArgentinaArmeniaAsiaAustraliaAustriaBahamasBangladeshBarbadosBelarusBelgiumBelizeBoliviaBosnia and HerzegovinaBrazilBulgariaBurma/MyanmarCabo VerdeCambodiaCameroonCanadaCaribbeanCentral AmericaChileChinaColombiaCongoCosta RicaCroatiaCubaCzechoslovakiaDenmarkDominicaDominican RepublicEastern AfricaEastern AsiaEastern EuropeEcuadorEgyptEl SalvadorEnglandEritreaEthiopiaEuropeFijiFranceGermanyGhanaGreeceGrenadaGuatemalaGuyanaHaitiHondurasHong KongHungaryIndiaIndonesiaIranIraqIrelandIsraelItalyJamaicaJapanJordanKazakhstanKenyaKoreaKuwaitLaosLatin AmericaLatviaLebanonLiberiaLithuaniaMalaysiaMexicoMicronesiaMiddle AfricaMoldovaMoroccoNepalNetherlandsNicaraguaNigeriaNorth AmericaNorth MacedoniaNorthern AfricaNorthern EuropeNorwayOceaniaPakistanPanamaPeruPhilippinesPolandPortugalRomaniaRussiaSaudi ArabiaScotlandSenegalSerbiaSierra LeoneSingaporeSomaliaSouth AfricaSouth AmericaSouth Central AsiaSouth Eastern AsiaSouthern EuropeSpainSri LankaSt. Vincent and the GrenadinesSudanSwedenSwitzerlandSyriaTaiwanThailandTrinidad and TobagoTurkeyUgandaUkraineUruguayUzbekistanVenezuelaVietnamWest IndiesWestern AfricaWestern AsiaWestern EuropeYemenZaireZimbabweAzores
In Labor Force | Age 20-64
Income
Poverty
Unemployment
Labor Participation
Family Structure
Vehicle Availability
Education Level
Disability

In Labor Force | Age 20-64 Comparison

Immigrants from Albania

Zimbabweans

Exceptional
Exceptional
80.3%
IN LABOR FORCE | AGE 20-64
98.7/ 100
METRIC RATING
64th/ 347
METRIC RANK
81.0%
IN LABOR FORCE | AGE 20-64
100.0/ 100
METRIC RATING
19th/ 347
METRIC RANK

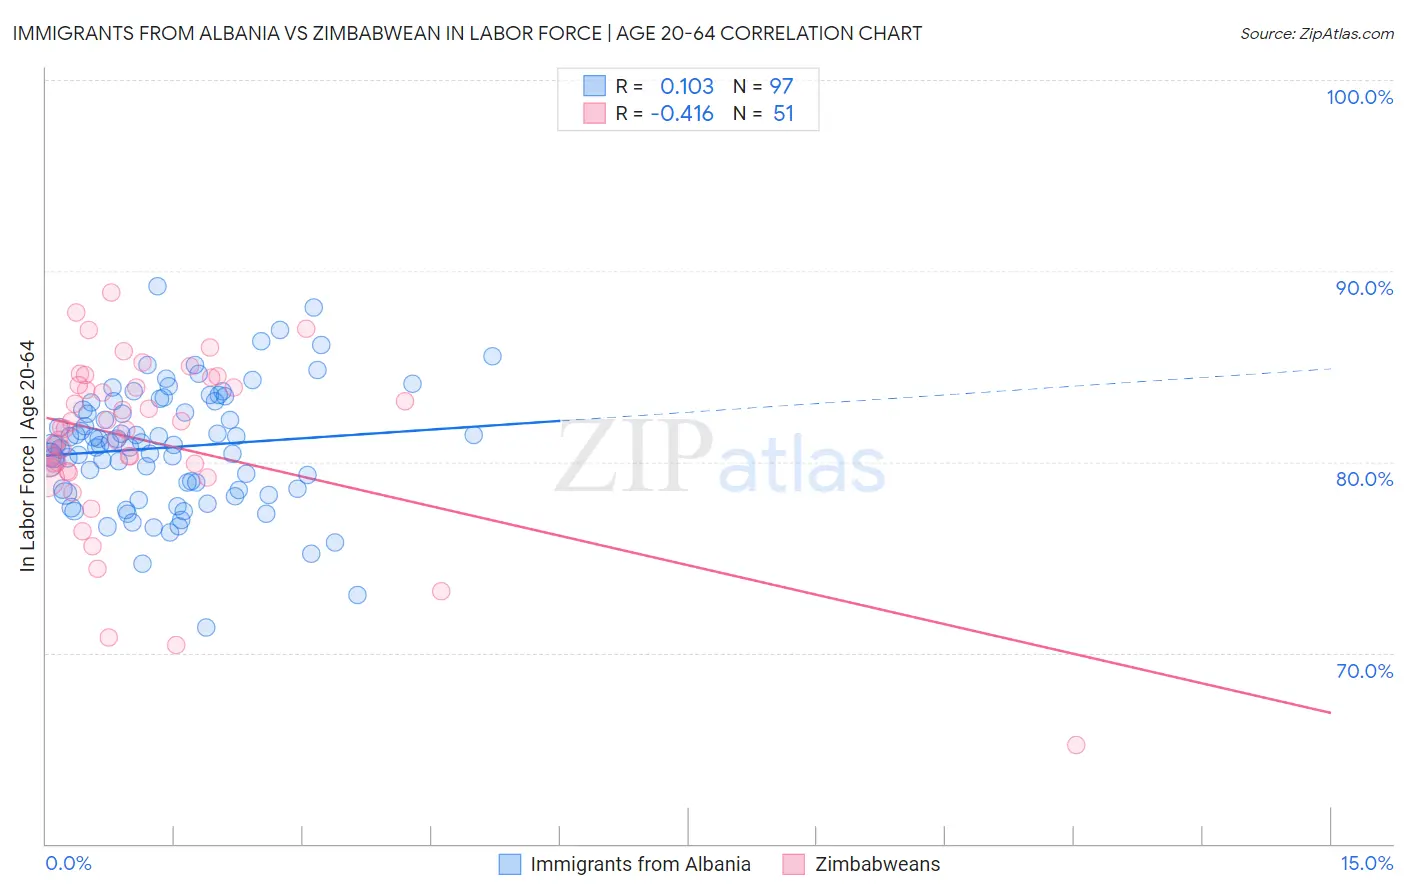
Immigrants from Albania vs Zimbabwean In Labor Force | Age 20-64 Correlation Chart

The statistical analysis conducted on geographies consisting of 119,398,682 people shows a poor positive correlation between the proportion of Immigrants from Albania and labor force participation rate among population between the ages 20 and 64 in the United States with a correlation coefficient (R) of 0.103 and weighted average of 80.3%. Similarly, the statistical analysis conducted on geographies consisting of 69,208,654 people shows a moderate negative correlation between the proportion of Zimbabweans and labor force participation rate among population between the ages 20 and 64 in the United States with a correlation coefficient (R) of -0.416 and weighted average of 81.0%, a difference of 0.87%.
Immigrants from Albania vs Zimbabwean In Labor Force | Age 20-64

In Labor Force | Age 20-64 Correlation Summary

MeasurementImmigrants from AlbaniaZimbabwean
Minimum71.3%65.2%
Maximum89.2%88.9%
Range17.9%23.7%
Mean80.8%81.1%
Median80.9%81.7%
Interquartile 25% (IQ1)78.5%79.5%
Interquartile 75% (IQ3)83.1%84.0%
Interquartile Range (IQR)4.6%4.5%
Standard Deviation (Sample)3.2%4.5%
Standard Deviation (Population)3.1%4.5%

Similar Demographics by In Labor Force | Age 20-64

Demographics Similar to Immigrants from Albania by In Labor Force | Age 20-64

In terms of in labor force | age 20-64, the demographic groups most similar to Immigrants from Albania are Immigrants from Korea (80.3%, a difference of 0.0%), Carpatho Rusyn (80.3%, a difference of 0.010%), Lithuanian (80.2%, a difference of 0.010%), Macedonian (80.2%, a difference of 0.010%), and Taiwanese (80.2%, a difference of 0.010%).
DemographicsRating | RankIn Labor Force | Age 20-64
Afghans
98.9
/100
|
#57
Exceptional
80.3%
Serbians
98.9
/100
|
#58
Exceptional
80.3%
Swedes
98.9
/100
|
#59
Exceptional
80.3%
Tongans
98.8
/100
|
#60
Exceptional
80.3%
Burmese
98.8
/100
|
#61
Exceptional
80.3%
Carpatho Rusyns
98.8
/100
|
#62
Exceptional
80.3%
Immigrants | Korea
98.8
/100
|
#63
Exceptional
80.3%
Immigrants | Albania
98.7
/100
|
#64
Exceptional
80.3%
Lithuanians
98.7
/100
|
#65
Exceptional
80.2%
Macedonians
98.7
/100
|
#66
Exceptional
80.2%
Taiwanese
98.6
/100
|
#67
Exceptional
80.2%
Bhutanese
98.6
/100
|
#68
Exceptional
80.2%
Albanians
98.6
/100
|
#69
Exceptional
80.2%
Immigrants | Turkey
98.5
/100
|
#70
Exceptional
80.2%
Soviet Union
98.5
/100
|
#71
Exceptional
80.2%

Demographics Similar to Zimbabweans by In Labor Force | Age 20-64

In terms of in labor force | age 20-64, the demographic groups most similar to Zimbabweans are Immigrants from Bulgaria (81.0%, a difference of 0.0%), Norwegian (81.0%, a difference of 0.020%), Thai (80.9%, a difference of 0.050%), Liberian (80.9%, a difference of 0.070%), and Bulgarian (81.1%, a difference of 0.12%).
DemographicsRating | RankIn Labor Force | Age 20-64
Immigrants | Eritrea
100.0
/100
|
#12
Exceptional
81.3%
Immigrants | India
100.0
/100
|
#13
Exceptional
81.3%
Cambodians
100.0
/100
|
#14
Exceptional
81.1%
Bulgarians
100.0
/100
|
#15
Exceptional
81.1%
Immigrants | Nepal
100.0
/100
|
#16
Exceptional
81.1%
Norwegians
100.0
/100
|
#17
Exceptional
81.0%
Immigrants | Bulgaria
100.0
/100
|
#18
Exceptional
81.0%
Zimbabweans
100.0
/100
|
#19
Exceptional
81.0%
Thais
100.0
/100
|
#20
Exceptional
80.9%
Liberians
100.0
/100
|
#21
Exceptional
80.9%
Sudanese
100.0
/100
|
#22
Exceptional
80.8%
Immigrants | Bosnia and Herzegovina
100.0
/100
|
#23
Exceptional
80.8%
Immigrants | Morocco
100.0
/100
|
#24
Exceptional
80.8%
Kenyans
100.0
/100
|
#25
Exceptional
80.8%
Immigrants | Serbia
100.0
/100
|
#26
Exceptional
80.8%