Hopi vs Immigrants from Burma/Myanmar In Labor Force | Age 25-29

COMPARE

Hopi
Race
Ancestry
AfghanAfricanAlaska NativeAlaskan AthabascanAlbanianAleutAlsatianAmericanApacheArabArapahoArgentineanArmenianAssyrian/Chaldean/SyriacAustralianAustrianBahamianBangladeshiBarbadianBasqueBelgianBelizeanBermudanBhutaneseBlackfeetBolivianBrazilianBritishBritish West IndianBulgarianBurmeseCajunCambodianCanadianCape VerdeanCarpatho RusynCelticCentral AmericanCentral American IndianCherokeeCheyenneChickasawChileanChineseChippewaChoctawColombianColvilleComancheCosta RicanCreeCreekCroatianCrowCubanCypriotCzechCzechoslovakianDanishDelawareDominicanDutchDutch West IndianEastern EuropeanEcuadorianEgyptianEnglishEstonianEthiopianEuropeanFijianFilipinoFinnishFrenchFrench American IndianFrench CanadianGermanGerman RussianGhanaianGreekGuamanian/ChamorroGuatemalanGuyaneseHaitianHmongHonduranHopiHoumaHungarianIcelanderIndian (Asian)IndonesianInupiatIranianIraqiIrishIroquoisIsraeliItalianJamaicanJapaneseJordanianKenyanKiowaKoreanLaotianLatvianLebaneseLiberianLithuanianLumbeeLuxembourgerMacedonianMalaysianMalteseMarshalleseMenomineeMexicanMexican American IndianMongolianMoroccanNative HawaiianNavajoNepaleseNew ZealanderNicaraguanNigerianNorthern EuropeanNorwegianOkinawanOsageOttawaPaiutePakistaniPalestinianPanamanianParaguayanPennsylvania GermanPeruvianPimaPolishPortuguesePotawatomiPuebloPuerto RicanPuget Sound SalishRomanianRussianSalvadoranSamoanScandinavianScotch-IrishScottishSeminoleSenegaleseSerbianShoshoneSierra LeoneanSiouxSlavicSlovakSloveneSomaliSouth AfricanSouth AmericanSouth American IndianSoviet UnionSpaniardSpanishSpanish AmericanSpanish American IndianSri LankanSubsaharan AfricanSudaneseSwedishSwissSyrianTaiwaneseThaiTlingit-HaidaTohono O'OdhamTonganTrinidadian and TobagonianTsimshianTurkishU.S. Virgin IslanderUgandanUkrainianUruguayanUteVenezuelanVietnameseWelshWest IndianYakamaYaquiYugoslavianYumanYup'ikZimbabwean
Immigration
NonimmigrantsImmigrantsAfghanistanAfricaAlbaniaArgentinaArmeniaAsiaAustraliaAustriaBahamasBangladeshBarbadosBelarusBelgiumBelizeBoliviaBosnia and HerzegovinaBrazilBulgariaCabo VerdeCambodiaCameroonCanadaCaribbeanCentral AmericaChileChinaColombiaCongoCosta RicaCroatiaCubaCzechoslovakiaDenmarkDominicaDominican RepublicEastern AfricaEastern AsiaEastern EuropeEcuadorEgyptEl SalvadorEnglandEritreaEthiopiaEuropeFijiFranceGermanyGhanaGreeceGrenadaGuatemalaGuyanaHaitiHondurasHong KongHungaryIndiaIndonesiaIranIraqIrelandIsraelItalyJamaicaJapanJordanKazakhstanKenyaKoreaKuwaitLaosLatin AmericaLatviaLebanonLiberiaLithuaniaMalaysiaMexicoMicronesiaMiddle AfricaMoldovaMoroccoNepalNetherlandsNicaraguaNigeriaNorth AmericaNorth MacedoniaNorthern AfricaNorthern EuropeNorwayOceaniaPakistanPanamaPeruPhilippinesPolandPortugalRomaniaRussiaSaudi ArabiaScotlandSenegalSerbiaSierra LeoneSingaporeSomaliaSouth AfricaSouth AmericaSouth Central AsiaSouth Eastern AsiaSouthern EuropeSpainSri LankaSt. Vincent and the GrenadinesSudanSwedenSwitzerlandSyriaTaiwanThailandTrinidad and TobagoTurkeyUgandaUkraineUruguayUzbekistanVenezuelaVietnamWest IndiesWestern AfricaWestern AsiaWestern EuropeYemenZaireZimbabweAzores
Immigrants from Burma/Myanmar
Race
Ancestry
AfghanAfricanAlaska NativeAlaskan AthabascanAlbanianAleutAlsatianAmericanApacheArabArapahoArgentineanArmenianAssyrian/Chaldean/SyriacAustralianAustrianBahamianBangladeshiBarbadianBasqueBelgianBelizeanBermudanBhutaneseBlackfeetBolivianBrazilianBritishBritish West IndianBulgarianBurmeseCajunCambodianCanadianCape VerdeanCarpatho RusynCelticCentral AmericanCentral American IndianCherokeeCheyenneChickasawChileanChineseChippewaChoctawColombianColvilleComancheCosta RicanCreeCreekCroatianCrowCubanCypriotCzechCzechoslovakianDanishDelawareDominicanDutchDutch West IndianEastern EuropeanEcuadorianEgyptianEnglishEstonianEthiopianEuropeanFijianFilipinoFinnishFrenchFrench American IndianFrench CanadianGermanGerman RussianGhanaianGreekGuamanian/ChamorroGuatemalanGuyaneseHaitianHmongHonduranHoumaHungarianIcelanderIndian (Asian)IndonesianInupiatIranianIraqiIrishIroquoisIsraeliItalianJamaicanJapaneseJordanianKenyanKiowaKoreanLaotianLatvianLebaneseLiberianLithuanianLumbeeLuxembourgerMacedonianMalaysianMalteseMarshalleseMenomineeMexicanMexican American IndianMongolianMoroccanNative HawaiianNavajoNepaleseNew ZealanderNicaraguanNigerianNorthern EuropeanNorwegianOkinawanOsageOttawaPaiutePakistaniPalestinianPanamanianParaguayanPennsylvania GermanPeruvianPimaPolishPortuguesePotawatomiPuebloPuerto RicanPuget Sound SalishRomanianRussianSalvadoranSamoanScandinavianScotch-IrishScottishSeminoleSenegaleseSerbianShoshoneSierra LeoneanSiouxSlavicSlovakSloveneSomaliSouth AfricanSouth AmericanSouth American IndianSoviet UnionSpaniardSpanishSpanish AmericanSpanish American IndianSri LankanSubsaharan AfricanSudaneseSwedishSwissSyrianTaiwaneseThaiTlingit-HaidaTohono O'OdhamTonganTrinidadian and TobagonianTsimshianTurkishU.S. Virgin IslanderUgandanUkrainianUruguayanUteVenezuelanVietnameseWelshWest IndianYakamaYaquiYugoslavianYumanYup'ikZimbabwean
Immigration
NonimmigrantsImmigrantsAfghanistanAfricaAlbaniaArgentinaArmeniaAsiaAustraliaAustriaBahamasBangladeshBarbadosBelarusBelgiumBelizeBoliviaBosnia and HerzegovinaBrazilBulgariaBurma/MyanmarCabo VerdeCambodiaCameroonCanadaCaribbeanCentral AmericaChileChinaColombiaCongoCosta RicaCroatiaCubaCzechoslovakiaDenmarkDominicaDominican RepublicEastern AfricaEastern AsiaEastern EuropeEcuadorEgyptEl SalvadorEnglandEritreaEthiopiaEuropeFijiFranceGermanyGhanaGreeceGrenadaGuatemalaGuyanaHaitiHondurasHong KongHungaryIndiaIndonesiaIranIraqIrelandIsraelItalyJamaicaJapanJordanKazakhstanKenyaKoreaKuwaitLaosLatin AmericaLatviaLebanonLiberiaLithuaniaMalaysiaMexicoMicronesiaMiddle AfricaMoldovaMoroccoNepalNetherlandsNicaraguaNigeriaNorth AmericaNorth MacedoniaNorthern AfricaNorthern EuropeNorwayOceaniaPakistanPanamaPeruPhilippinesPolandPortugalRomaniaRussiaSaudi ArabiaScotlandSenegalSerbiaSierra LeoneSingaporeSomaliaSouth AfricaSouth AmericaSouth Central AsiaSouth Eastern AsiaSouthern EuropeSpainSri LankaSt. Vincent and the GrenadinesSudanSwedenSwitzerlandSyriaTaiwanThailandTrinidad and TobagoTurkeyUgandaUkraineUruguayUzbekistanVenezuelaVietnamWest IndiesWestern AfricaWestern AsiaWestern EuropeYemenZaireZimbabweAzores
In Labor Force | Age 25-29
Income
Poverty
Unemployment
Labor Participation
Family Structure
Vehicle Availability
Education Level
Disability

In Labor Force | Age 25-29 Comparison

Hopi

Immigrants from Burma/Myanmar

Tragic
Average
76.5%
IN LABOR FORCE | AGE 25-29
0.0/ 100
METRIC RATING
344th/ 347
METRIC RANK
84.7%
IN LABOR FORCE | AGE 25-29
57.4/ 100
METRIC RATING
165th/ 347
METRIC RANK

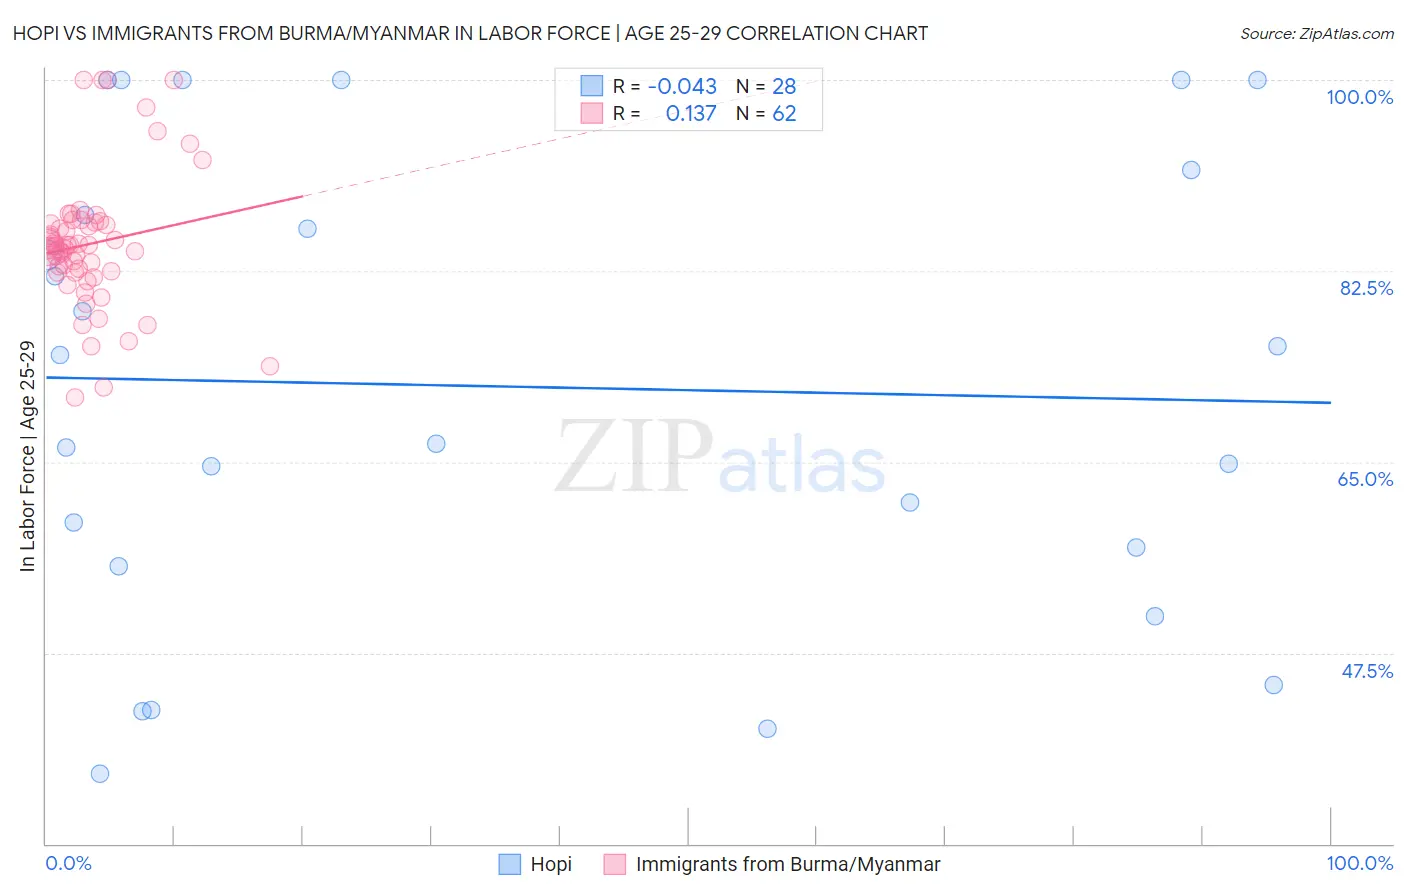
Hopi vs Immigrants from Burma/Myanmar In Labor Force | Age 25-29 Correlation Chart

The statistical analysis conducted on geographies consisting of 74,722,734 people shows no correlation between the proportion of Hopi and labor force participation rate among population between the ages 25 and 29 in the United States with a correlation coefficient (R) of -0.043 and weighted average of 76.5%. Similarly, the statistical analysis conducted on geographies consisting of 172,340,666 people shows a poor positive correlation between the proportion of Immigrants from Burma/Myanmar and labor force participation rate among population between the ages 25 and 29 in the United States with a correlation coefficient (R) of 0.137 and weighted average of 84.7%, a difference of 10.7%.
Hopi vs Immigrants from Burma/Myanmar In Labor Force | Age 25-29

In Labor Force | Age 25-29 Correlation Summary

MeasurementHopiImmigrants from Burma/Myanmar
Minimum36.4%70.9%
Maximum100.0%100.0%
Range63.6%29.1%
Mean71.9%85.0%
Median70.8%84.7%
Interquartile 25% (IQ1)56.3%82.4%
Interquartile 75% (IQ3)89.7%86.9%
Interquartile Range (IQR)33.4%4.5%
Standard Deviation (Sample)21.1%6.2%
Standard Deviation (Population)20.7%6.2%

Similar Demographics by In Labor Force | Age 25-29

Demographics Similar to Hopi by In Labor Force | Age 25-29

In terms of in labor force | age 25-29, the demographic groups most similar to Hopi are Arapaho (76.6%, a difference of 0.060%), Pueblo (77.5%, a difference of 1.3%), Tohono O'odham (77.5%, a difference of 1.3%), Paiute (78.1%, a difference of 2.1%), and Immigrants from Yemen (78.2%, a difference of 2.2%).
DemographicsRating | RankIn Labor Force | Age 25-29
Sioux
0.0
/100
|
#333
Tragic
79.7%
Yuman
0.0
/100
|
#334
Tragic
79.3%
Natives/Alaskans
0.0
/100
|
#335
Tragic
79.3%
Apache
0.0
/100
|
#336
Tragic
79.2%
Crow
0.0
/100
|
#337
Tragic
78.6%
Lumbee
0.0
/100
|
#338
Tragic
78.3%
Immigrants | Yemen
0.0
/100
|
#339
Tragic
78.2%
Paiute
0.0
/100
|
#340
Tragic
78.1%
Tohono O'odham
0.0
/100
|
#341
Tragic
77.5%
Pueblo
0.0
/100
|
#342
Tragic
77.5%
Arapaho
0.0
/100
|
#343
Tragic
76.6%
Hopi
0.0
/100
|
#344
Tragic
76.5%
Navajo
0.0
/100
|
#345
Tragic
74.6%
Pima
0.0
/100
|
#346
Tragic
74.3%
Yup'ik
0.0
/100
|
#347
Tragic
73.1%

Demographics Similar to Immigrants from Burma/Myanmar by In Labor Force | Age 25-29

In terms of in labor force | age 25-29, the demographic groups most similar to Immigrants from Burma/Myanmar are Argentinean (84.7%, a difference of 0.0%), Ghanaian (84.7%, a difference of 0.0%), Immigrants from Spain (84.7%, a difference of 0.0%), Immigrants from Peru (84.7%, a difference of 0.010%), and Canadian (84.7%, a difference of 0.010%).
DemographicsRating | RankIn Labor Force | Age 25-29
Immigrants | Ghana
60.2
/100
|
#158
Good
84.7%
Immigrants | Western Africa
60.1
/100
|
#159
Good
84.7%
Immigrants | Peru
58.6
/100
|
#160
Average
84.7%
Canadians
58.5
/100
|
#161
Average
84.7%
Immigrants | Colombia
58.3
/100
|
#162
Average
84.7%
Argentineans
57.9
/100
|
#163
Average
84.7%
Ghanaians
57.6
/100
|
#164
Average
84.7%
Immigrants | Burma/Myanmar
57.4
/100
|
#165
Average
84.7%
Immigrants | Spain
56.9
/100
|
#166
Average
84.7%
Indonesians
56.5
/100
|
#167
Average
84.7%
South Americans
54.9
/100
|
#168
Average
84.7%
Celtics
52.5
/100
|
#169
Average
84.7%
Tongans
52.4
/100
|
#170
Average
84.7%
Immigrants | Vietnam
50.5
/100
|
#171
Average
84.7%
Immigrants | Western Europe
50.4
/100
|
#172
Average
84.7%