Haitian vs Subsaharan African In Labor Force | Age 30-34

COMPARE

Haitian
Race
Ancestry
AfghanAfricanAlaska NativeAlaskan AthabascanAlbanianAleutAlsatianAmericanApacheArabArapahoArgentineanArmenianAssyrian/Chaldean/SyriacAustralianAustrianBahamianBangladeshiBarbadianBasqueBelgianBelizeanBermudanBhutaneseBlackfeetBolivianBrazilianBritishBritish West IndianBulgarianBurmeseCajunCambodianCanadianCape VerdeanCarpatho RusynCelticCentral AmericanCentral American IndianCherokeeCheyenneChickasawChileanChineseChippewaChoctawColombianColvilleComancheCosta RicanCreeCreekCroatianCrowCubanCypriotCzechCzechoslovakianDanishDelawareDominicanDutchDutch West IndianEastern EuropeanEcuadorianEgyptianEnglishEstonianEthiopianEuropeanFijianFilipinoFinnishFrenchFrench American IndianFrench CanadianGermanGerman RussianGhanaianGreekGuamanian/ChamorroGuatemalanGuyaneseHaitianHmongHonduranHopiHoumaHungarianIcelanderIndian (Asian)IndonesianInupiatIranianIraqiIrishIroquoisIsraeliItalianJamaicanJapaneseJordanianKenyanKiowaKoreanLaotianLatvianLebaneseLiberianLithuanianLumbeeLuxembourgerMacedonianMalaysianMalteseMarshalleseMenomineeMexicanMexican American IndianMongolianMoroccanNative HawaiianNavajoNepaleseNew ZealanderNicaraguanNigerianNorthern EuropeanNorwegianOkinawanOsageOttawaPaiutePakistaniPalestinianPanamanianParaguayanPennsylvania GermanPeruvianPimaPolishPortuguesePotawatomiPuebloPuerto RicanPuget Sound SalishRomanianRussianSalvadoranSamoanScandinavianScotch-IrishScottishSeminoleSenegaleseSerbianShoshoneSierra LeoneanSiouxSlavicSlovakSloveneSomaliSouth AfricanSouth AmericanSouth American IndianSoviet UnionSpaniardSpanishSpanish AmericanSpanish American IndianSri LankanSudaneseSwedishSwissSyrianTaiwaneseThaiTlingit-HaidaTohono O'OdhamTonganTrinidadian and TobagonianTsimshianTurkishU.S. Virgin IslanderUgandanUkrainianUruguayanUteVenezuelanVietnameseWelshWest IndianYakamaYaquiYugoslavianYumanYup'ikZimbabwean
Immigration
NonimmigrantsImmigrantsAfghanistanAfricaAlbaniaArgentinaArmeniaAsiaAustraliaAustriaBahamasBangladeshBarbadosBelarusBelgiumBelizeBoliviaBosnia and HerzegovinaBrazilBulgariaBurma/MyanmarCabo VerdeCambodiaCameroonCanadaCaribbeanCentral AmericaChileChinaColombiaCongoCosta RicaCroatiaCubaCzechoslovakiaDenmarkDominicaDominican RepublicEastern AfricaEastern AsiaEastern EuropeEcuadorEgyptEl SalvadorEnglandEritreaEthiopiaEuropeFijiFranceGermanyGhanaGreeceGrenadaGuatemalaGuyanaHaitiHondurasHong KongHungaryIndiaIndonesiaIranIraqIrelandIsraelItalyJamaicaJapanJordanKazakhstanKenyaKoreaKuwaitLaosLatin AmericaLatviaLebanonLiberiaLithuaniaMalaysiaMexicoMicronesiaMiddle AfricaMoldovaMoroccoNepalNetherlandsNicaraguaNigeriaNorth AmericaNorth MacedoniaNorthern AfricaNorthern EuropeNorwayOceaniaPakistanPanamaPeruPhilippinesPolandPortugalRomaniaRussiaSaudi ArabiaScotlandSenegalSerbiaSierra LeoneSingaporeSomaliaSouth AfricaSouth AmericaSouth Central AsiaSouth Eastern AsiaSouthern EuropeSpainSri LankaSt. Vincent and the GrenadinesSudanSwedenSwitzerlandSyriaTaiwanThailandTrinidad and TobagoTurkeyUgandaUkraineUruguayUzbekistanVenezuelaVietnamWest IndiesWestern AfricaWestern AsiaWestern EuropeYemenZaireZimbabweAzores
Subsaharan African
Race
Ancestry
AfghanAfricanAlaska NativeAlaskan AthabascanAlbanianAleutAlsatianAmericanApacheArabArapahoArgentineanArmenianAssyrian/Chaldean/SyriacAustralianAustrianBahamianBangladeshiBarbadianBasqueBelgianBelizeanBermudanBhutaneseBlackfeetBolivianBrazilianBritishBritish West IndianBulgarianBurmeseCajunCambodianCanadianCape VerdeanCarpatho RusynCelticCentral AmericanCentral American IndianCherokeeCheyenneChickasawChileanChineseChippewaChoctawColombianColvilleComancheCosta RicanCreeCreekCroatianCrowCubanCypriotCzechCzechoslovakianDanishDelawareDominicanDutchDutch West IndianEastern EuropeanEcuadorianEgyptianEnglishEstonianEthiopianEuropeanFijianFilipinoFinnishFrenchFrench American IndianFrench CanadianGermanGerman RussianGhanaianGreekGuamanian/ChamorroGuatemalanGuyaneseHmongHonduranHopiHoumaHungarianIcelanderIndian (Asian)IndonesianInupiatIranianIraqiIrishIroquoisIsraeliItalianJamaicanJapaneseJordanianKenyanKiowaKoreanLaotianLatvianLebaneseLiberianLithuanianLumbeeLuxembourgerMacedonianMalaysianMalteseMarshalleseMenomineeMexicanMexican American IndianMongolianMoroccanNative HawaiianNavajoNepaleseNew ZealanderNicaraguanNigerianNorthern EuropeanNorwegianOkinawanOsageOttawaPaiutePakistaniPalestinianPanamanianParaguayanPennsylvania GermanPeruvianPimaPolishPortuguesePotawatomiPuebloPuerto RicanPuget Sound SalishRomanianRussianSalvadoranSamoanScandinavianScotch-IrishScottishSeminoleSenegaleseSerbianShoshoneSierra LeoneanSiouxSlavicSlovakSloveneSomaliSouth AfricanSouth AmericanSouth American IndianSoviet UnionSpaniardSpanishSpanish AmericanSpanish American IndianSri LankanSubsaharan AfricanSudaneseSwedishSwissSyrianTaiwaneseThaiTlingit-HaidaTohono O'OdhamTonganTrinidadian and TobagonianTsimshianTurkishU.S. Virgin IslanderUgandanUkrainianUruguayanUteVenezuelanVietnameseWelshWest IndianYakamaYaquiYugoslavianYumanYup'ikZimbabwean
Immigration
NonimmigrantsImmigrantsAfghanistanAfricaAlbaniaArgentinaArmeniaAsiaAustraliaAustriaBahamasBangladeshBarbadosBelarusBelgiumBelizeBoliviaBosnia and HerzegovinaBrazilBulgariaBurma/MyanmarCabo VerdeCambodiaCameroonCanadaCaribbeanCentral AmericaChileChinaColombiaCongoCosta RicaCroatiaCubaCzechoslovakiaDenmarkDominicaDominican RepublicEastern AfricaEastern AsiaEastern EuropeEcuadorEgyptEl SalvadorEnglandEritreaEthiopiaEuropeFijiFranceGermanyGhanaGreeceGrenadaGuatemalaGuyanaHaitiHondurasHong KongHungaryIndiaIndonesiaIranIraqIrelandIsraelItalyJamaicaJapanJordanKazakhstanKenyaKoreaKuwaitLaosLatin AmericaLatviaLebanonLiberiaLithuaniaMalaysiaMexicoMicronesiaMiddle AfricaMoldovaMoroccoNepalNetherlandsNicaraguaNigeriaNorth AmericaNorth MacedoniaNorthern AfricaNorthern EuropeNorwayOceaniaPakistanPanamaPeruPhilippinesPolandPortugalRomaniaRussiaSaudi ArabiaScotlandSenegalSerbiaSierra LeoneSingaporeSomaliaSouth AfricaSouth AmericaSouth Central AsiaSouth Eastern AsiaSouthern EuropeSpainSri LankaSt. Vincent and the GrenadinesSudanSwedenSwitzerlandSyriaTaiwanThailandTrinidad and TobagoTurkeyUgandaUkraineUruguayUzbekistanVenezuelaVietnamWest IndiesWestern AfricaWestern AsiaWestern EuropeYemenZaireZimbabweAzores
In Labor Force | Age 30-34
Income
Poverty
Unemployment
Labor Participation
Family Structure
Vehicle Availability
Education Level
Disability

In Labor Force | Age 30-34 Comparison

Haitians

Sub-Saharan Africans

Tragic
Poor
84.1%
IN LABOR FORCE | AGE 30-34
1.8/ 100
METRIC RATING
234th/ 347
METRIC RANK
84.5%
IN LABOR FORCE | AGE 30-34
19.0/ 100
METRIC RATING
200th/ 347
METRIC RANK

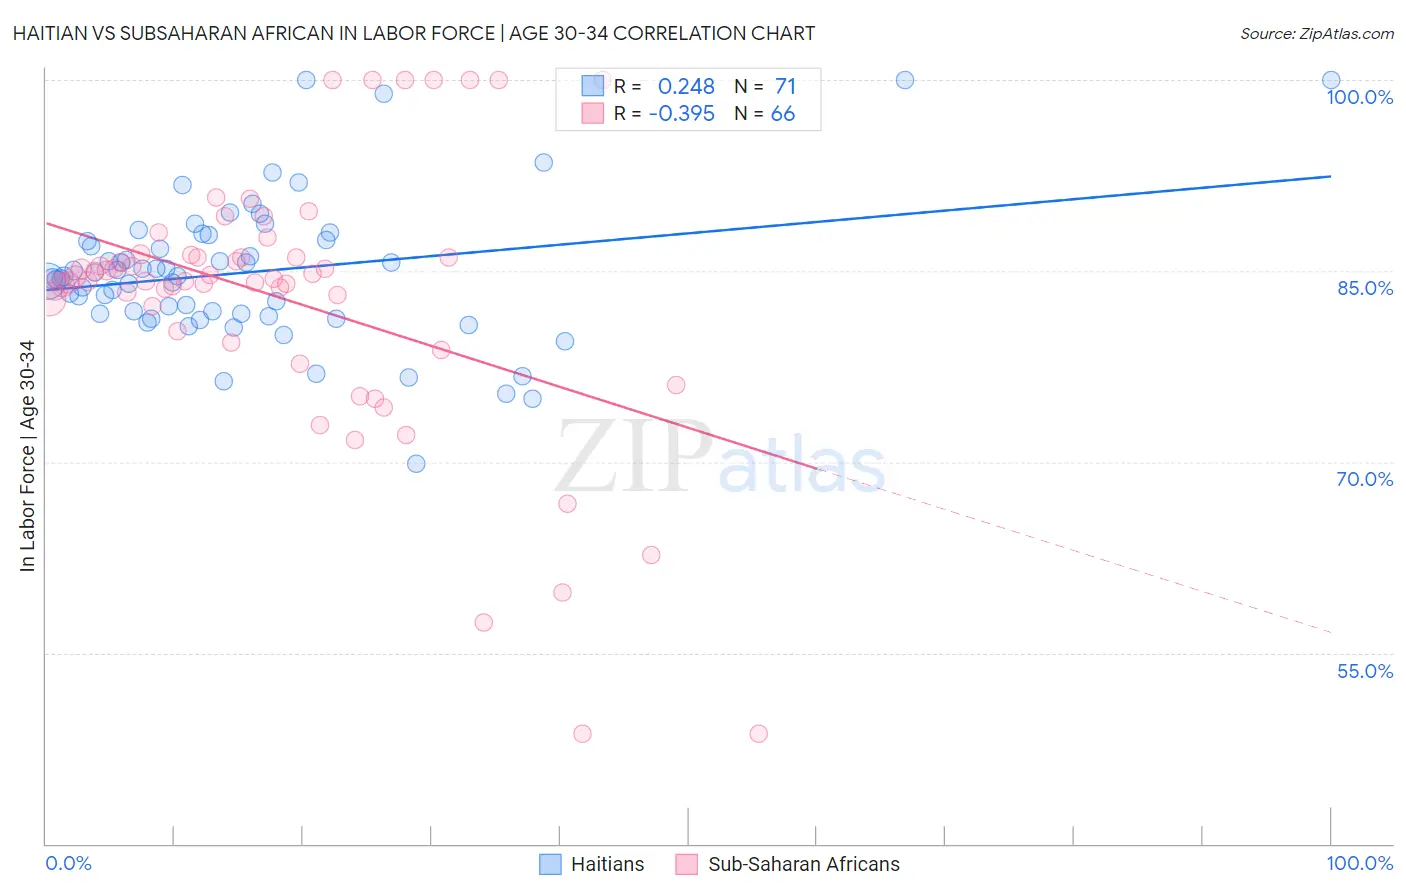
Haitian vs Subsaharan African In Labor Force | Age 30-34 Correlation Chart

The statistical analysis conducted on geographies consisting of 287,776,350 people shows a weak positive correlation between the proportion of Haitians and labor force participation rate among population between the ages 30 and 34 in the United States with a correlation coefficient (R) of 0.248 and weighted average of 84.1%. Similarly, the statistical analysis conducted on geographies consisting of 507,574,791 people shows a mild negative correlation between the proportion of Sub-Saharan Africans and labor force participation rate among population between the ages 30 and 34 in the United States with a correlation coefficient (R) of -0.395 and weighted average of 84.5%, a difference of 0.45%.
Haitian vs Subsaharan African In Labor Force | Age 30-34

In Labor Force | Age 30-34 Correlation Summary

MeasurementHaitianSubsaharan African
Minimum69.8%48.6%
Maximum100.0%100.0%
Range30.2%51.4%
Mean84.9%82.8%
Median84.6%84.3%
Interquartile 25% (IQ1)81.6%80.3%
Interquartile 75% (IQ3)87.4%86.1%
Interquartile Range (IQR)5.8%5.8%
Standard Deviation (Sample)5.6%10.6%
Standard Deviation (Population)5.6%10.5%

Similar Demographics by In Labor Force | Age 30-34

Demographics Similar to Haitians by In Labor Force | Age 30-34

In terms of in labor force | age 30-34, the demographic groups most similar to Haitians are West Indian (84.1%, a difference of 0.010%), French American Indian (84.1%, a difference of 0.010%), Immigrants (84.1%, a difference of 0.020%), U.S. Virgin Islander (84.1%, a difference of 0.030%), and Malaysian (84.1%, a difference of 0.040%).
DemographicsRating | RankIn Labor Force | Age 30-34
Immigrants | Cuba
3.0
/100
|
#227
Tragic
84.2%
Immigrants | Haiti
2.8
/100
|
#228
Tragic
84.2%
Welsh
2.7
/100
|
#229
Tragic
84.2%
Immigrants | Bahamas
2.6
/100
|
#230
Tragic
84.1%
Malaysians
2.2
/100
|
#231
Tragic
84.1%
Immigrants | Immigrants
2.0
/100
|
#232
Tragic
84.1%
West Indians
1.9
/100
|
#233
Tragic
84.1%
Haitians
1.8
/100
|
#234
Tragic
84.1%
French American Indians
1.7
/100
|
#235
Tragic
84.1%
U.S. Virgin Islanders
1.5
/100
|
#236
Tragic
84.1%
Celtics
1.4
/100
|
#237
Tragic
84.1%
Immigrants | Barbados
1.4
/100
|
#238
Tragic
84.0%
English
1.4
/100
|
#239
Tragic
84.0%
Venezuelans
1.3
/100
|
#240
Tragic
84.0%
Immigrants | Portugal
1.2
/100
|
#241
Tragic
84.0%

Demographics Similar to Sub-Saharan Africans by In Labor Force | Age 30-34

In terms of in labor force | age 30-34, the demographic groups most similar to Sub-Saharan Africans are Immigrants from Thailand (84.5%, a difference of 0.0%), Dutch (84.5%, a difference of 0.010%), Trinidadian and Tobagonian (84.5%, a difference of 0.010%), Immigrants from West Indies (84.5%, a difference of 0.010%), and Immigrants from Syria (84.5%, a difference of 0.030%).
DemographicsRating | RankIn Labor Force | Age 30-34
Immigrants | Costa Rica
23.9
/100
|
#193
Fair
84.5%
Immigrants | Afghanistan
23.5
/100
|
#194
Fair
84.5%
Koreans
23.2
/100
|
#195
Fair
84.5%
British
22.9
/100
|
#196
Fair
84.5%
Immigrants | Syria
21.9
/100
|
#197
Fair
84.5%
Dutch
20.2
/100
|
#198
Fair
84.5%
Immigrants | Thailand
19.1
/100
|
#199
Poor
84.5%
Sub-Saharan Africans
19.0
/100
|
#200
Poor
84.5%
Trinidadians and Tobagonians
18.2
/100
|
#201
Poor
84.5%
Immigrants | West Indies
18.1
/100
|
#202
Poor
84.5%
Canadians
15.4
/100
|
#203
Poor
84.4%
Ecuadorians
14.2
/100
|
#204
Poor
84.4%
French
13.8
/100
|
#205
Poor
84.4%
Lebanese
10.6
/100
|
#206
Poor
84.4%
Bangladeshis
9.4
/100
|
#207
Tragic
84.3%