Haitian vs Immigrants from Trinidad and Tobago In Labor Force | Age 16-19

COMPARE

Haitian
Race
Ancestry
AfghanAfricanAlaska NativeAlaskan AthabascanAlbanianAleutAlsatianAmericanApacheArabArapahoArgentineanArmenianAssyrian/Chaldean/SyriacAustralianAustrianBahamianBangladeshiBarbadianBasqueBelgianBelizeanBermudanBhutaneseBlackfeetBolivianBrazilianBritishBritish West IndianBulgarianBurmeseCajunCambodianCanadianCape VerdeanCarpatho RusynCelticCentral AmericanCentral American IndianCherokeeCheyenneChickasawChileanChineseChippewaChoctawColombianColvilleComancheCosta RicanCreeCreekCroatianCrowCubanCypriotCzechCzechoslovakianDanishDelawareDominicanDutchDutch West IndianEastern EuropeanEcuadorianEgyptianEnglishEstonianEthiopianEuropeanFijianFilipinoFinnishFrenchFrench American IndianFrench CanadianGermanGerman RussianGhanaianGreekGuamanian/ChamorroGuatemalanGuyaneseHaitianHmongHonduranHopiHoumaHungarianIcelanderIndian (Asian)IndonesianInupiatIranianIraqiIrishIroquoisIsraeliItalianJamaicanJapaneseJordanianKenyanKiowaKoreanLaotianLatvianLebaneseLiberianLithuanianLumbeeLuxembourgerMacedonianMalaysianMalteseMarshalleseMenomineeMexicanMexican American IndianMongolianMoroccanNative HawaiianNavajoNepaleseNew ZealanderNicaraguanNigerianNorthern EuropeanNorwegianOkinawanOsageOttawaPaiutePakistaniPalestinianPanamanianParaguayanPennsylvania GermanPeruvianPimaPolishPortuguesePotawatomiPuebloPuerto RicanPuget Sound SalishRomanianRussianSalvadoranSamoanScandinavianScotch-IrishScottishSeminoleSenegaleseSerbianShoshoneSierra LeoneanSiouxSlavicSlovakSloveneSomaliSouth AfricanSouth AmericanSouth American IndianSoviet UnionSpaniardSpanishSpanish AmericanSpanish American IndianSri LankanSubsaharan AfricanSudaneseSwedishSwissSyrianTaiwaneseThaiTlingit-HaidaTohono O'OdhamTonganTrinidadian and TobagonianTsimshianTurkishU.S. Virgin IslanderUgandanUkrainianUruguayanUteVenezuelanVietnameseWelshWest IndianYakamaYaquiYugoslavianYumanYup'ikZimbabwean
Immigration
NonimmigrantsImmigrantsAfghanistanAfricaAlbaniaArgentinaArmeniaAsiaAustraliaAustriaBahamasBangladeshBarbadosBelarusBelgiumBelizeBoliviaBosnia and HerzegovinaBrazilBulgariaBurma/MyanmarCabo VerdeCambodiaCameroonCanadaCaribbeanCentral AmericaChileChinaColombiaCongoCosta RicaCroatiaCubaCzechoslovakiaDenmarkDominicaDominican RepublicEastern AfricaEastern AsiaEastern EuropeEcuadorEgyptEl SalvadorEnglandEritreaEthiopiaEuropeFijiFranceGermanyGhanaGreeceGrenadaGuatemalaGuyanaHaitiHondurasHong KongHungaryIndiaIndonesiaIranIraqIrelandIsraelItalyJamaicaJapanJordanKazakhstanKenyaKoreaKuwaitLaosLatin AmericaLatviaLebanonLiberiaLithuaniaMalaysiaMexicoMicronesiaMiddle AfricaMoldovaMoroccoNepalNetherlandsNicaraguaNigeriaNorth AmericaNorth MacedoniaNorthern AfricaNorthern EuropeNorwayOceaniaPakistanPanamaPeruPhilippinesPolandPortugalRomaniaRussiaSaudi ArabiaScotlandSenegalSerbiaSierra LeoneSingaporeSomaliaSouth AfricaSouth AmericaSouth Central AsiaSouth Eastern AsiaSouthern EuropeSpainSri LankaSt. Vincent and the GrenadinesSudanSwedenSwitzerlandSyriaTaiwanThailandTurkeyUgandaUkraineUruguayUzbekistanVenezuelaVietnamWest IndiesWestern AfricaWestern AsiaWestern EuropeYemenZaireZimbabweAzores
Immigrants from Trinidad and Tobago
Race
Ancestry
AfghanAfricanAlaska NativeAlaskan AthabascanAlbanianAleutAlsatianAmericanApacheArabArapahoArgentineanArmenianAssyrian/Chaldean/SyriacAustralianAustrianBahamianBangladeshiBarbadianBasqueBelgianBelizeanBermudanBhutaneseBlackfeetBolivianBrazilianBritishBritish West IndianBulgarianBurmeseCajunCambodianCanadianCape VerdeanCarpatho RusynCelticCentral AmericanCentral American IndianCherokeeCheyenneChickasawChileanChineseChippewaChoctawColombianColvilleComancheCosta RicanCreeCreekCroatianCrowCubanCypriotCzechCzechoslovakianDanishDelawareDominicanDutchDutch West IndianEastern EuropeanEcuadorianEgyptianEnglishEstonianEthiopianEuropeanFijianFilipinoFinnishFrenchFrench American IndianFrench CanadianGermanGerman RussianGhanaianGreekGuamanian/ChamorroGuatemalanGuyaneseHmongHonduranHopiHoumaHungarianIcelanderIndian (Asian)IndonesianInupiatIranianIraqiIrishIroquoisIsraeliItalianJamaicanJapaneseJordanianKenyanKiowaKoreanLaotianLatvianLebaneseLiberianLithuanianLumbeeLuxembourgerMacedonianMalaysianMalteseMarshalleseMenomineeMexicanMexican American IndianMongolianMoroccanNative HawaiianNavajoNepaleseNew ZealanderNicaraguanNigerianNorthern EuropeanNorwegianOkinawanOsageOttawaPaiutePakistaniPalestinianPanamanianParaguayanPennsylvania GermanPeruvianPimaPolishPortuguesePotawatomiPuebloPuerto RicanPuget Sound SalishRomanianRussianSalvadoranSamoanScandinavianScotch-IrishScottishSeminoleSenegaleseSerbianShoshoneSierra LeoneanSiouxSlavicSlovakSloveneSomaliSouth AfricanSouth AmericanSouth American IndianSoviet UnionSpaniardSpanishSpanish AmericanSpanish American IndianSri LankanSubsaharan AfricanSudaneseSwedishSwissSyrianTaiwaneseThaiTlingit-HaidaTohono O'OdhamTonganTrinidadian and TobagonianTsimshianTurkishU.S. Virgin IslanderUgandanUkrainianUruguayanUteVenezuelanVietnameseWelshWest IndianYakamaYaquiYugoslavianYumanYup'ikZimbabwean
Immigration
NonimmigrantsImmigrantsAfghanistanAfricaAlbaniaArgentinaArmeniaAsiaAustraliaAustriaBahamasBangladeshBarbadosBelarusBelgiumBelizeBoliviaBosnia and HerzegovinaBrazilBulgariaBurma/MyanmarCabo VerdeCambodiaCameroonCanadaCaribbeanCentral AmericaChileChinaColombiaCongoCosta RicaCroatiaCubaCzechoslovakiaDenmarkDominicaDominican RepublicEastern AfricaEastern AsiaEastern EuropeEcuadorEgyptEl SalvadorEnglandEritreaEthiopiaEuropeFijiFranceGermanyGhanaGreeceGrenadaGuatemalaGuyanaHaitiHondurasHong KongHungaryIndiaIndonesiaIranIraqIrelandIsraelItalyJamaicaJapanJordanKazakhstanKenyaKoreaKuwaitLaosLatin AmericaLatviaLebanonLiberiaLithuaniaMalaysiaMexicoMicronesiaMiddle AfricaMoldovaMoroccoNepalNetherlandsNicaraguaNigeriaNorth AmericaNorth MacedoniaNorthern AfricaNorthern EuropeNorwayOceaniaPakistanPanamaPeruPhilippinesPolandPortugalRomaniaRussiaSaudi ArabiaScotlandSenegalSerbiaSierra LeoneSingaporeSomaliaSouth AfricaSouth AmericaSouth Central AsiaSouth Eastern AsiaSouthern EuropeSpainSri LankaSt. Vincent and the GrenadinesSudanSwedenSwitzerlandSyriaTaiwanThailandTrinidad and TobagoTurkeyUgandaUkraineUruguayUzbekistanVenezuelaVietnamWest IndiesWestern AfricaWestern AsiaWestern EuropeYemenZaireZimbabweAzores
In Labor Force | Age 16-19
Income
Poverty
Unemployment
Labor Participation
Family Structure
Vehicle Availability
Education Level
Disability

In Labor Force | Age 16-19 Comparison

Haitians

Immigrants from Trinidad and Tobago

Tragic
Tragic
33.4%
IN LABOR FORCE | AGE 16-19
0.1/ 100
METRIC RATING
292nd/ 347
METRIC RANK
30.2%
IN LABOR FORCE | AGE 16-19
0.0/ 100
METRIC RATING
336th/ 347
METRIC RANK

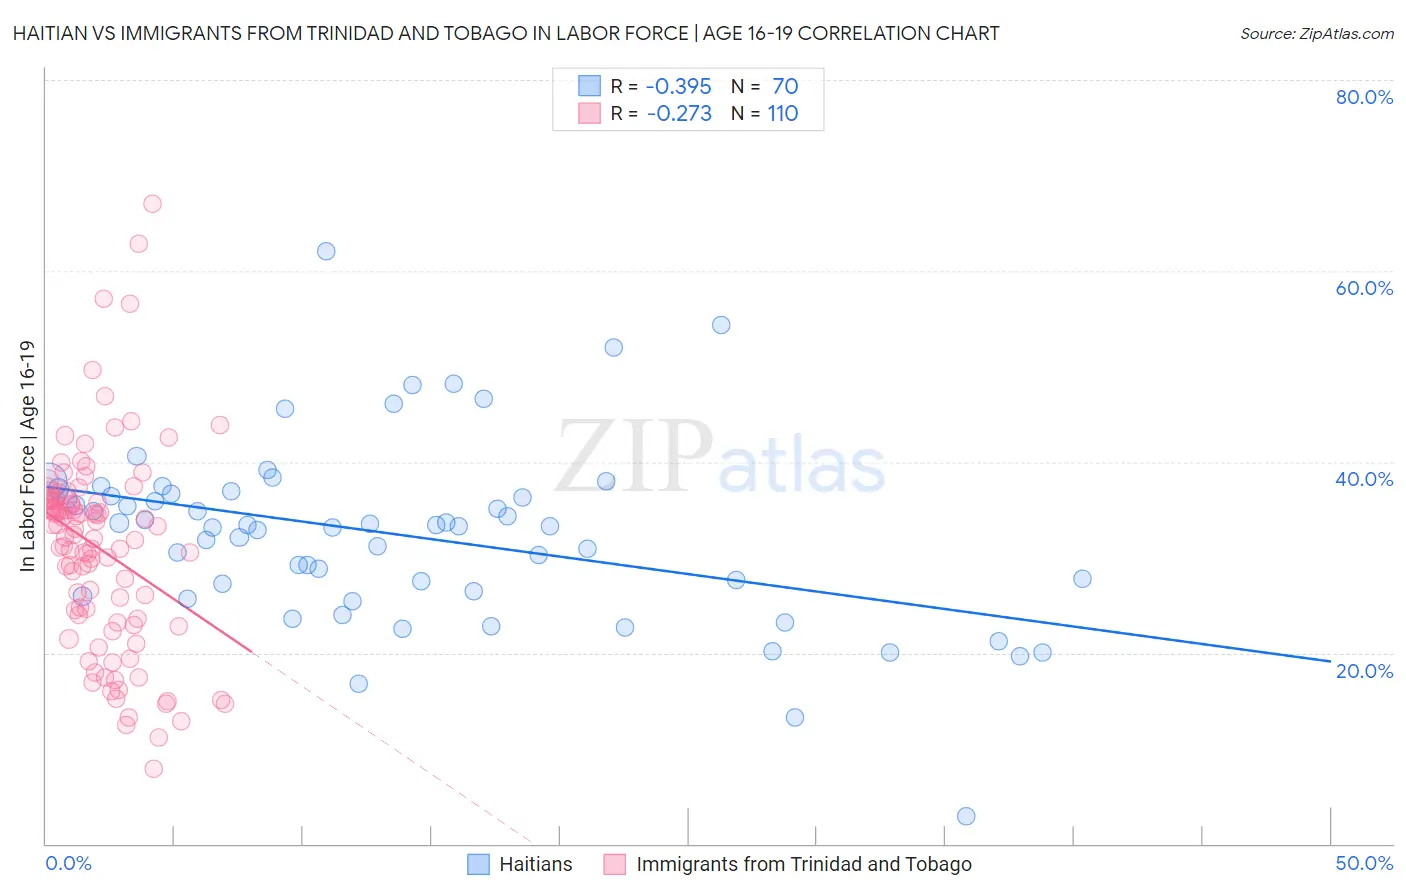
Haitian vs Immigrants from Trinidad and Tobago In Labor Force | Age 16-19 Correlation Chart

The statistical analysis conducted on geographies consisting of 287,710,811 people shows a mild negative correlation between the proportion of Haitians and labor force participation rate among population between the ages 16 and 19 in the United States with a correlation coefficient (R) of -0.395 and weighted average of 33.4%. Similarly, the statistical analysis conducted on geographies consisting of 223,335,847 people shows a weak negative correlation between the proportion of Immigrants from Trinidad and Tobago and labor force participation rate among population between the ages 16 and 19 in the United States with a correlation coefficient (R) of -0.273 and weighted average of 30.2%, a difference of 10.8%.
Haitian vs Immigrants from Trinidad and Tobago In Labor Force | Age 16-19

In Labor Force | Age 16-19 Correlation Summary

MeasurementHaitianImmigrants from Trinidad and Tobago
Minimum2.9%7.9%
Maximum62.0%67.1%
Range59.1%59.2%
Mean32.3%30.9%
Median33.2%32.2%
Interquartile 25% (IQ1)26.5%23.6%
Interquartile 75% (IQ3)36.6%36.1%
Interquartile Range (IQR)10.1%12.5%
Standard Deviation (Sample)9.5%10.6%
Standard Deviation (Population)9.5%10.5%

Similar Demographics by In Labor Force | Age 16-19

Demographics Similar to Haitians by In Labor Force | Age 16-19

In terms of in labor force | age 16-19, the demographic groups most similar to Haitians are Immigrants from Belarus (33.4%, a difference of 0.060%), Immigrants from Colombia (33.5%, a difference of 0.14%), Immigrants from Indonesia (33.5%, a difference of 0.28%), Immigrants from Singapore (33.5%, a difference of 0.28%), and Nepalese (33.5%, a difference of 0.32%).
DemographicsRating | RankIn Labor Force | Age 16-19
U.S. Virgin Islanders
0.2
/100
|
#285
Tragic
33.6%
South Americans
0.2
/100
|
#286
Tragic
33.6%
Nepalese
0.1
/100
|
#287
Tragic
33.5%
Immigrants | Indonesia
0.1
/100
|
#288
Tragic
33.5%
Immigrants | Singapore
0.1
/100
|
#289
Tragic
33.5%
Immigrants | Colombia
0.1
/100
|
#290
Tragic
33.5%
Immigrants | Belarus
0.1
/100
|
#291
Tragic
33.4%
Haitians
0.1
/100
|
#292
Tragic
33.4%
Immigrants | South America
0.1
/100
|
#293
Tragic
33.3%
Argentineans
0.1
/100
|
#294
Tragic
33.3%
Yup'ik
0.1
/100
|
#295
Tragic
33.3%
Jamaicans
0.1
/100
|
#296
Tragic
33.2%
Immigrants | Haiti
0.1
/100
|
#297
Tragic
33.2%
Iranians
0.0
/100
|
#298
Tragic
33.0%
Armenians
0.0
/100
|
#299
Tragic
32.9%

Demographics Similar to Immigrants from Trinidad and Tobago by In Labor Force | Age 16-19

In terms of in labor force | age 16-19, the demographic groups most similar to Immigrants from Trinidad and Tobago are Immigrants from Cuba (30.2%, a difference of 0.29%), Immigrants from Bangladesh (30.0%, a difference of 0.37%), Puerto Rican (30.3%, a difference of 0.62%), Immigrants from Hong Kong (30.5%, a difference of 1.0%), and Immigrants from Israel (30.5%, a difference of 1.1%).
DemographicsRating | RankIn Labor Force | Age 16-19
Barbadians
0.0
/100
|
#329
Tragic
31.0%
Lumbee
0.0
/100
|
#330
Tragic
31.0%
Trinidadians and Tobagonians
0.0
/100
|
#331
Tragic
30.9%
Immigrants | Israel
0.0
/100
|
#332
Tragic
30.5%
Immigrants | Hong Kong
0.0
/100
|
#333
Tragic
30.5%
Puerto Ricans
0.0
/100
|
#334
Tragic
30.3%
Immigrants | Cuba
0.0
/100
|
#335
Tragic
30.2%
Immigrants | Trinidad and Tobago
0.0
/100
|
#336
Tragic
30.2%
Immigrants | Bangladesh
0.0
/100
|
#337
Tragic
30.0%
Vietnamese
0.0
/100
|
#338
Tragic
29.6%
Immigrants | Uzbekistan
0.0
/100
|
#339
Tragic
29.2%
British West Indians
0.0
/100
|
#340
Tragic
29.1%
Immigrants | Armenia
0.0
/100
|
#341
Tragic
29.0%
Immigrants | Barbados
0.0
/100
|
#342
Tragic
29.0%
Yuman
0.0
/100
|
#343
Tragic
27.7%