Guatemalan vs White/Caucasian In Labor Force | Age 30-34

COMPARE

Guatemalan
Race
Ancestry
AfghanAfricanAlaska NativeAlaskan AthabascanAlbanianAleutAlsatianAmericanApacheArabArapahoArgentineanArmenianAssyrian/Chaldean/SyriacAustralianAustrianBahamianBangladeshiBarbadianBasqueBelgianBelizeanBermudanBhutaneseBlackfeetBolivianBrazilianBritishBritish West IndianBulgarianBurmeseCajunCambodianCanadianCape VerdeanCarpatho RusynCelticCentral AmericanCentral American IndianCherokeeCheyenneChickasawChileanChineseChippewaChoctawColombianColvilleComancheCosta RicanCreeCreekCroatianCrowCubanCypriotCzechCzechoslovakianDanishDelawareDominicanDutchDutch West IndianEastern EuropeanEcuadorianEgyptianEnglishEstonianEthiopianEuropeanFijianFilipinoFinnishFrenchFrench American IndianFrench CanadianGermanGerman RussianGhanaianGreekGuamanian/ChamorroGuatemalanGuyaneseHaitianHmongHonduranHopiHoumaHungarianIcelanderIndian (Asian)IndonesianInupiatIranianIraqiIrishIroquoisIsraeliItalianJamaicanJapaneseJordanianKenyanKiowaKoreanLaotianLatvianLebaneseLiberianLithuanianLumbeeLuxembourgerMacedonianMalaysianMalteseMarshalleseMenomineeMexicanMexican American IndianMongolianMoroccanNative HawaiianNavajoNepaleseNew ZealanderNicaraguanNigerianNorthern EuropeanNorwegianOkinawanOsageOttawaPaiutePakistaniPalestinianPanamanianParaguayanPennsylvania GermanPeruvianPimaPolishPortuguesePotawatomiPuebloPuerto RicanPuget Sound SalishRomanianRussianSalvadoranSamoanScandinavianScotch-IrishScottishSeminoleSenegaleseSerbianShoshoneSierra LeoneanSiouxSlavicSlovakSloveneSomaliSouth AfricanSouth AmericanSouth American IndianSoviet UnionSpaniardSpanishSpanish AmericanSpanish American IndianSri LankanSubsaharan AfricanSudaneseSwedishSwissSyrianTaiwaneseThaiTlingit-HaidaTohono O'OdhamTonganTrinidadian and TobagonianTsimshianTurkishU.S. Virgin IslanderUgandanUkrainianUruguayanUteVenezuelanVietnameseWelshWest IndianYakamaYaquiYugoslavianYumanYup'ikZimbabwean
Immigration
NonimmigrantsImmigrantsAfghanistanAfricaAlbaniaArgentinaArmeniaAsiaAustraliaAustriaBahamasBangladeshBarbadosBelarusBelgiumBelizeBoliviaBosnia and HerzegovinaBrazilBulgariaBurma/MyanmarCabo VerdeCambodiaCameroonCanadaCaribbeanCentral AmericaChileChinaColombiaCongoCosta RicaCroatiaCubaCzechoslovakiaDenmarkDominicaDominican RepublicEastern AfricaEastern AsiaEastern EuropeEcuadorEgyptEl SalvadorEnglandEritreaEthiopiaEuropeFijiFranceGermanyGhanaGreeceGrenadaGuatemalaGuyanaHaitiHondurasHong KongHungaryIndiaIndonesiaIranIraqIrelandIsraelItalyJamaicaJapanJordanKazakhstanKenyaKoreaKuwaitLaosLatin AmericaLatviaLebanonLiberiaLithuaniaMalaysiaMexicoMicronesiaMiddle AfricaMoldovaMoroccoNepalNetherlandsNicaraguaNigeriaNorth AmericaNorth MacedoniaNorthern AfricaNorthern EuropeNorwayOceaniaPakistanPanamaPeruPhilippinesPolandPortugalRomaniaRussiaSaudi ArabiaScotlandSenegalSerbiaSierra LeoneSingaporeSomaliaSouth AfricaSouth AmericaSouth Central AsiaSouth Eastern AsiaSouthern EuropeSpainSri LankaSt. Vincent and the GrenadinesSudanSwedenSwitzerlandSyriaTaiwanThailandTrinidad and TobagoTurkeyUgandaUkraineUruguayUzbekistanVenezuelaVietnamWest IndiesWestern AfricaWestern AsiaWestern EuropeYemenZaireZimbabweAzores
White/Caucasian
Race
Ancestry
AfghanAfricanAlaska NativeAlaskan AthabascanAlbanianAleutAlsatianAmericanApacheArabArapahoArgentineanArmenianAssyrian/Chaldean/SyriacAustralianAustrianBahamianBangladeshiBarbadianBasqueBelgianBelizeanBermudanBhutaneseBlackfeetBolivianBrazilianBritishBritish West IndianBulgarianBurmeseCajunCambodianCanadianCape VerdeanCarpatho RusynCelticCentral AmericanCentral American IndianCherokeeCheyenneChickasawChileanChineseChippewaChoctawColombianColvilleComancheCosta RicanCreeCreekCroatianCrowCubanCypriotCzechCzechoslovakianDanishDelawareDominicanDutchDutch West IndianEastern EuropeanEcuadorianEgyptianEnglishEstonianEthiopianEuropeanFijianFilipinoFinnishFrenchFrench American IndianFrench CanadianGermanGerman RussianGhanaianGreekGuamanian/ChamorroGuyaneseHaitianHmongHonduranHopiHoumaHungarianIcelanderIndian (Asian)IndonesianInupiatIranianIraqiIrishIroquoisIsraeliItalianJamaicanJapaneseJordanianKenyanKiowaKoreanLaotianLatvianLebaneseLiberianLithuanianLumbeeLuxembourgerMacedonianMalaysianMalteseMarshalleseMenomineeMexicanMexican American IndianMongolianMoroccanNative HawaiianNavajoNepaleseNew ZealanderNicaraguanNigerianNorthern EuropeanNorwegianOkinawanOsageOttawaPaiutePakistaniPalestinianPanamanianParaguayanPennsylvania GermanPeruvianPimaPolishPortuguesePotawatomiPuebloPuerto RicanPuget Sound SalishRomanianRussianSalvadoranSamoanScandinavianScotch-IrishScottishSeminoleSenegaleseSerbianShoshoneSierra LeoneanSiouxSlavicSlovakSloveneSomaliSouth AfricanSouth AmericanSouth American IndianSoviet UnionSpaniardSpanishSpanish AmericanSpanish American IndianSri LankanSubsaharan AfricanSudaneseSwedishSwissSyrianTaiwaneseThaiTlingit-HaidaTohono O'OdhamTonganTrinidadian and TobagonianTsimshianTurkishU.S. Virgin IslanderUgandanUkrainianUruguayanUteVenezuelanVietnameseWelshWest IndianYakamaYaquiYugoslavianYumanYup'ikZimbabwean
Immigration
NonimmigrantsImmigrantsAfghanistanAfricaAlbaniaArgentinaArmeniaAsiaAustraliaAustriaBahamasBangladeshBarbadosBelarusBelgiumBelizeBoliviaBosnia and HerzegovinaBrazilBulgariaBurma/MyanmarCabo VerdeCambodiaCameroonCanadaCaribbeanCentral AmericaChileChinaColombiaCongoCosta RicaCroatiaCubaCzechoslovakiaDenmarkDominicaDominican RepublicEastern AfricaEastern AsiaEastern EuropeEcuadorEgyptEl SalvadorEnglandEritreaEthiopiaEuropeFijiFranceGermanyGhanaGreeceGrenadaGuatemalaGuyanaHaitiHondurasHong KongHungaryIndiaIndonesiaIranIraqIrelandIsraelItalyJamaicaJapanJordanKazakhstanKenyaKoreaKuwaitLaosLatin AmericaLatviaLebanonLiberiaLithuaniaMalaysiaMexicoMicronesiaMiddle AfricaMoldovaMoroccoNepalNetherlandsNicaraguaNigeriaNorth AmericaNorth MacedoniaNorthern AfricaNorthern EuropeNorwayOceaniaPakistanPanamaPeruPhilippinesPolandPortugalRomaniaRussiaSaudi ArabiaScotlandSenegalSerbiaSierra LeoneSingaporeSomaliaSouth AfricaSouth AmericaSouth Central AsiaSouth Eastern AsiaSouthern EuropeSpainSri LankaSt. Vincent and the GrenadinesSudanSwedenSwitzerlandSyriaTaiwanThailandTrinidad and TobagoTurkeyUgandaUkraineUruguayUzbekistanVenezuelaVietnamWest IndiesWestern AfricaWestern AsiaWestern EuropeYemenZaireZimbabweAzores
In Labor Force | Age 30-34
Income
Poverty
Unemployment
Labor Participation
Family Structure
Vehicle Availability
Education Level
Disability

In Labor Force | Age 30-34 Comparison

Guatemalans

Whites/Caucasians

Tragic
Tragic
83.7%
IN LABOR FORCE | AGE 30-34
0.2/ 100
METRIC RATING
264th/ 347
METRIC RANK
83.9%
IN LABOR FORCE | AGE 30-34
0.5/ 100
METRIC RATING
255th/ 347
METRIC RANK

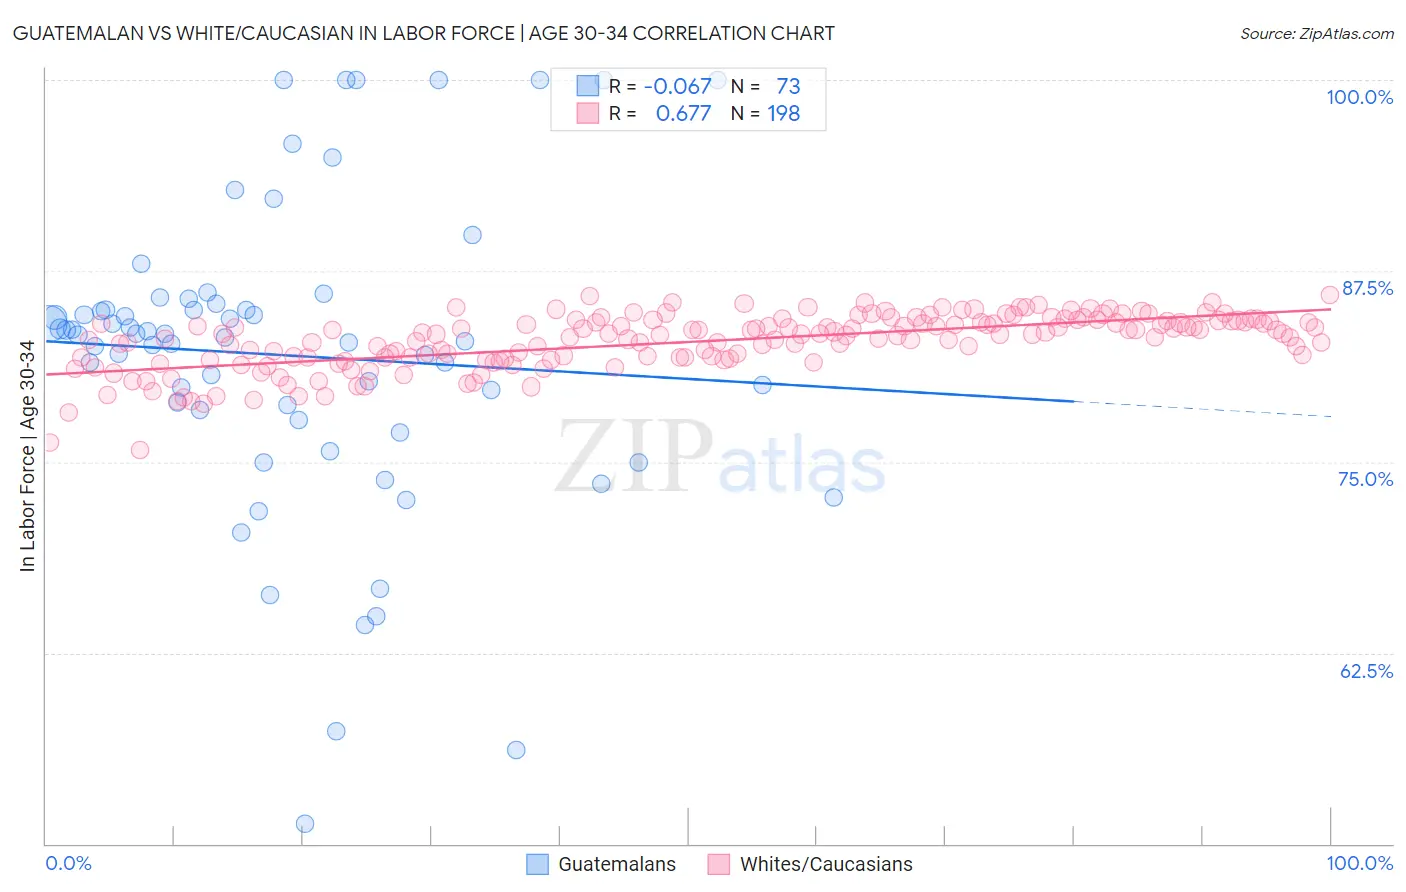
Guatemalan vs White/Caucasian In Labor Force | Age 30-34 Correlation Chart

The statistical analysis conducted on geographies consisting of 409,343,950 people shows a slight negative correlation between the proportion of Guatemalans and labor force participation rate among population between the ages 30 and 34 in the United States with a correlation coefficient (R) of -0.067 and weighted average of 83.7%. Similarly, the statistical analysis conducted on geographies consisting of 582,394,774 people shows a significant positive correlation between the proportion of Whites/Caucasians and labor force participation rate among population between the ages 30 and 34 in the United States with a correlation coefficient (R) of 0.677 and weighted average of 83.9%, a difference of 0.18%.
Guatemalan vs White/Caucasian In Labor Force | Age 30-34

In Labor Force | Age 30-34 Correlation Summary

MeasurementGuatemalanWhite/Caucasian
Minimum51.3%75.8%
Maximum100.0%85.9%
Range48.7%10.2%
Mean82.0%82.9%
Median83.3%83.4%
Interquartile 25% (IQ1)78.0%81.8%
Interquartile 75% (IQ3)85.1%84.2%
Interquartile Range (IQR)7.1%2.4%
Standard Deviation (Sample)10.0%1.8%
Standard Deviation (Population)9.9%1.8%

Demographics Similar to Guatemalans and Whites/Caucasians by In Labor Force | Age 30-34

In terms of in labor force | age 30-34, the demographic groups most similar to Guatemalans are Immigrants from Honduras (83.7%, a difference of 0.030%), Dominican (83.8%, a difference of 0.050%), Immigrants from Guyana (83.8%, a difference of 0.050%), Immigrants from Guatemala (83.7%, a difference of 0.050%), and Guyanese (83.8%, a difference of 0.070%). Similarly, the demographic groups most similar to Whites/Caucasians are Immigrants from St. Vincent and the Grenadines (83.9%, a difference of 0.020%), Nicaraguan (83.9%, a difference of 0.040%), Bahamian (83.9%, a difference of 0.040%), Immigrants from Nicaragua (83.9%, a difference of 0.040%), and Immigrants from Lebanon (83.9%, a difference of 0.040%).
DemographicsRating | RankIn Labor Force | Age 30-34
Immigrants | Dominica
0.7
/100
|
#249
Tragic
84.0%
Immigrants | Iraq
0.7
/100
|
#250
Tragic
83.9%
Nicaraguans
0.6
/100
|
#251
Tragic
83.9%
Bahamians
0.6
/100
|
#252
Tragic
83.9%
Immigrants | Nicaragua
0.6
/100
|
#253
Tragic
83.9%
Immigrants | St. Vincent and the Grenadines
0.5
/100
|
#254
Tragic
83.9%
Whites/Caucasians
0.5
/100
|
#255
Tragic
83.9%
Immigrants | Lebanon
0.4
/100
|
#256
Tragic
83.9%
Iraqis
0.3
/100
|
#257
Tragic
83.8%
Hondurans
0.3
/100
|
#258
Tragic
83.8%
Scotch-Irish
0.3
/100
|
#259
Tragic
83.8%
Immigrants | Dominican Republic
0.3
/100
|
#260
Tragic
83.8%
Guyanese
0.3
/100
|
#261
Tragic
83.8%
Dominicans
0.2
/100
|
#262
Tragic
83.8%
Immigrants | Guyana
0.2
/100
|
#263
Tragic
83.8%
Guatemalans
0.2
/100
|
#264
Tragic
83.7%
Immigrants | Honduras
0.1
/100
|
#265
Tragic
83.7%
Immigrants | Guatemala
0.1
/100
|
#266
Tragic
83.7%
Spaniards
0.1
/100
|
#267
Tragic
83.6%
Immigrants | Bangladesh
0.1
/100
|
#268
Tragic
83.6%
Vietnamese
0.1
/100
|
#269
Tragic
83.6%