European vs Immigrants from Panama In Labor Force | Age 45-54

COMPARE

European
Race
Ancestry
AfghanAfricanAlaska NativeAlaskan AthabascanAlbanianAleutAlsatianAmericanApacheArabArapahoArgentineanArmenianAssyrian/Chaldean/SyriacAustralianAustrianBahamianBangladeshiBarbadianBasqueBelgianBelizeanBermudanBhutaneseBlackfeetBolivianBrazilianBritishBritish West IndianBulgarianBurmeseCajunCambodianCanadianCape VerdeanCarpatho RusynCelticCentral AmericanCentral American IndianCherokeeCheyenneChickasawChileanChineseChippewaChoctawColombianColvilleComancheCosta RicanCreeCreekCroatianCrowCubanCypriotCzechCzechoslovakianDanishDelawareDominicanDutchDutch West IndianEastern EuropeanEcuadorianEgyptianEnglishEstonianEthiopianEuropeanFijianFilipinoFinnishFrenchFrench American IndianFrench CanadianGermanGerman RussianGhanaianGreekGuamanian/ChamorroGuatemalanGuyaneseHaitianHmongHonduranHopiHoumaHungarianIcelanderIndian (Asian)IndonesianInupiatIranianIraqiIrishIroquoisIsraeliItalianJamaicanJapaneseJordanianKenyanKiowaKoreanLaotianLatvianLebaneseLiberianLithuanianLumbeeLuxembourgerMacedonianMalaysianMalteseMarshalleseMenomineeMexicanMexican American IndianMongolianMoroccanNative HawaiianNavajoNepaleseNew ZealanderNicaraguanNigerianNorthern EuropeanNorwegianOkinawanOsageOttawaPaiutePakistaniPalestinianPanamanianParaguayanPennsylvania GermanPeruvianPimaPolishPortuguesePotawatomiPuebloPuerto RicanPuget Sound SalishRomanianRussianSalvadoranSamoanScandinavianScotch-IrishScottishSeminoleSenegaleseSerbianShoshoneSierra LeoneanSiouxSlavicSlovakSloveneSomaliSouth AfricanSouth AmericanSouth American IndianSoviet UnionSpaniardSpanishSpanish AmericanSpanish American IndianSri LankanSubsaharan AfricanSudaneseSwedishSwissSyrianTaiwaneseThaiTlingit-HaidaTohono O'OdhamTonganTrinidadian and TobagonianTsimshianTurkishU.S. Virgin IslanderUgandanUkrainianUruguayanUteVenezuelanVietnameseWelshWest IndianYakamaYaquiYugoslavianYumanYup'ikZimbabwean
Immigration
NonimmigrantsImmigrantsAfghanistanAfricaAlbaniaArgentinaArmeniaAsiaAustraliaAustriaBahamasBangladeshBarbadosBelarusBelgiumBelizeBoliviaBosnia and HerzegovinaBrazilBulgariaBurma/MyanmarCabo VerdeCambodiaCameroonCanadaCaribbeanCentral AmericaChileChinaColombiaCongoCosta RicaCroatiaCubaCzechoslovakiaDenmarkDominicaDominican RepublicEastern AfricaEastern AsiaEastern EuropeEcuadorEgyptEl SalvadorEnglandEritreaEthiopiaEuropeFijiFranceGermanyGhanaGreeceGrenadaGuatemalaGuyanaHaitiHondurasHong KongHungaryIndiaIndonesiaIranIraqIrelandIsraelItalyJamaicaJapanJordanKazakhstanKenyaKoreaKuwaitLaosLatin AmericaLatviaLebanonLiberiaLithuaniaMalaysiaMexicoMicronesiaMiddle AfricaMoldovaMoroccoNepalNetherlandsNicaraguaNigeriaNorth AmericaNorth MacedoniaNorthern AfricaNorthern EuropeNorwayOceaniaPakistanPeruPhilippinesPolandPortugalRomaniaRussiaSaudi ArabiaScotlandSenegalSerbiaSierra LeoneSingaporeSomaliaSouth AfricaSouth AmericaSouth Central AsiaSouth Eastern AsiaSouthern EuropeSpainSri LankaSt. Vincent and the GrenadinesSudanSwedenSwitzerlandSyriaTaiwanThailandTrinidad and TobagoTurkeyUgandaUkraineUruguayUzbekistanVenezuelaVietnamWest IndiesWestern AfricaWestern AsiaWestern EuropeYemenZaireZimbabweAzores
Immigrants from Panama
Race
Ancestry
AfghanAfricanAlaska NativeAlaskan AthabascanAlbanianAleutAlsatianAmericanApacheArabArapahoArgentineanArmenianAssyrian/Chaldean/SyriacAustralianAustrianBahamianBangladeshiBarbadianBasqueBelgianBelizeanBermudanBhutaneseBlackfeetBolivianBrazilianBritishBritish West IndianBulgarianBurmeseCajunCambodianCanadianCape VerdeanCarpatho RusynCelticCentral AmericanCentral American IndianCherokeeCheyenneChickasawChileanChineseChippewaChoctawColombianColvilleComancheCosta RicanCreeCreekCroatianCrowCubanCypriotCzechCzechoslovakianDanishDelawareDominicanDutchDutch West IndianEastern EuropeanEcuadorianEgyptianEnglishEstonianEthiopianFijianFilipinoFinnishFrenchFrench American IndianFrench CanadianGermanGerman RussianGhanaianGreekGuamanian/ChamorroGuatemalanGuyaneseHaitianHmongHonduranHopiHoumaHungarianIcelanderIndian (Asian)IndonesianInupiatIranianIraqiIrishIroquoisIsraeliItalianJamaicanJapaneseJordanianKenyanKiowaKoreanLaotianLatvianLebaneseLiberianLithuanianLumbeeLuxembourgerMacedonianMalaysianMalteseMarshalleseMenomineeMexicanMexican American IndianMongolianMoroccanNative HawaiianNavajoNepaleseNew ZealanderNicaraguanNigerianNorthern EuropeanNorwegianOkinawanOsageOttawaPaiutePakistaniPalestinianPanamanianParaguayanPennsylvania GermanPeruvianPimaPolishPortuguesePotawatomiPuebloPuerto RicanPuget Sound SalishRomanianRussianSalvadoranSamoanScandinavianScotch-IrishScottishSeminoleSenegaleseSerbianShoshoneSierra LeoneanSiouxSlavicSlovakSloveneSomaliSouth AfricanSouth AmericanSouth American IndianSoviet UnionSpaniardSpanishSpanish AmericanSpanish American IndianSri LankanSubsaharan AfricanSudaneseSwedishSwissSyrianTaiwaneseThaiTlingit-HaidaTohono O'OdhamTonganTrinidadian and TobagonianTsimshianTurkishU.S. Virgin IslanderUgandanUkrainianUruguayanUteVenezuelanVietnameseWelshWest IndianYakamaYaquiYugoslavianYumanYup'ikZimbabwean
Immigration
NonimmigrantsImmigrantsAfghanistanAfricaAlbaniaArgentinaArmeniaAsiaAustraliaAustriaBahamasBangladeshBarbadosBelarusBelgiumBelizeBoliviaBosnia and HerzegovinaBrazilBulgariaBurma/MyanmarCabo VerdeCambodiaCameroonCanadaCaribbeanCentral AmericaChileChinaColombiaCongoCosta RicaCroatiaCubaCzechoslovakiaDenmarkDominicaDominican RepublicEastern AfricaEastern AsiaEastern EuropeEcuadorEgyptEl SalvadorEnglandEritreaEthiopiaEuropeFijiFranceGermanyGhanaGreeceGrenadaGuatemalaGuyanaHaitiHondurasHong KongHungaryIndiaIndonesiaIranIraqIrelandIsraelItalyJamaicaJapanJordanKazakhstanKenyaKoreaKuwaitLaosLatin AmericaLatviaLebanonLiberiaLithuaniaMalaysiaMexicoMicronesiaMiddle AfricaMoldovaMoroccoNepalNetherlandsNicaraguaNigeriaNorth AmericaNorth MacedoniaNorthern AfricaNorthern EuropeNorwayOceaniaPakistanPanamaPeruPhilippinesPolandPortugalRomaniaRussiaSaudi ArabiaScotlandSenegalSerbiaSierra LeoneSingaporeSomaliaSouth AfricaSouth AmericaSouth Central AsiaSouth Eastern AsiaSouthern EuropeSpainSri LankaSt. Vincent and the GrenadinesSudanSwedenSwitzerlandSyriaTaiwanThailandTrinidad and TobagoTurkeyUgandaUkraineUruguayUzbekistanVenezuelaVietnamWest IndiesWestern AfricaWestern AsiaWestern EuropeYemenZaireZimbabweAzores
In Labor Force | Age 45-54
Income
Poverty
Unemployment
Labor Participation
Family Structure
Vehicle Availability
Education Level
Disability

In Labor Force | Age 45-54 Comparison

Europeans

Immigrants from Panama

Fair
Tragic
82.6%
IN LABOR FORCE | AGE 45-54
32.6/ 100
METRIC RATING
184th/ 347
METRIC RANK
82.2%
IN LABOR FORCE | AGE 45-54
5.6/ 100
METRIC RATING
214th/ 347
METRIC RANK

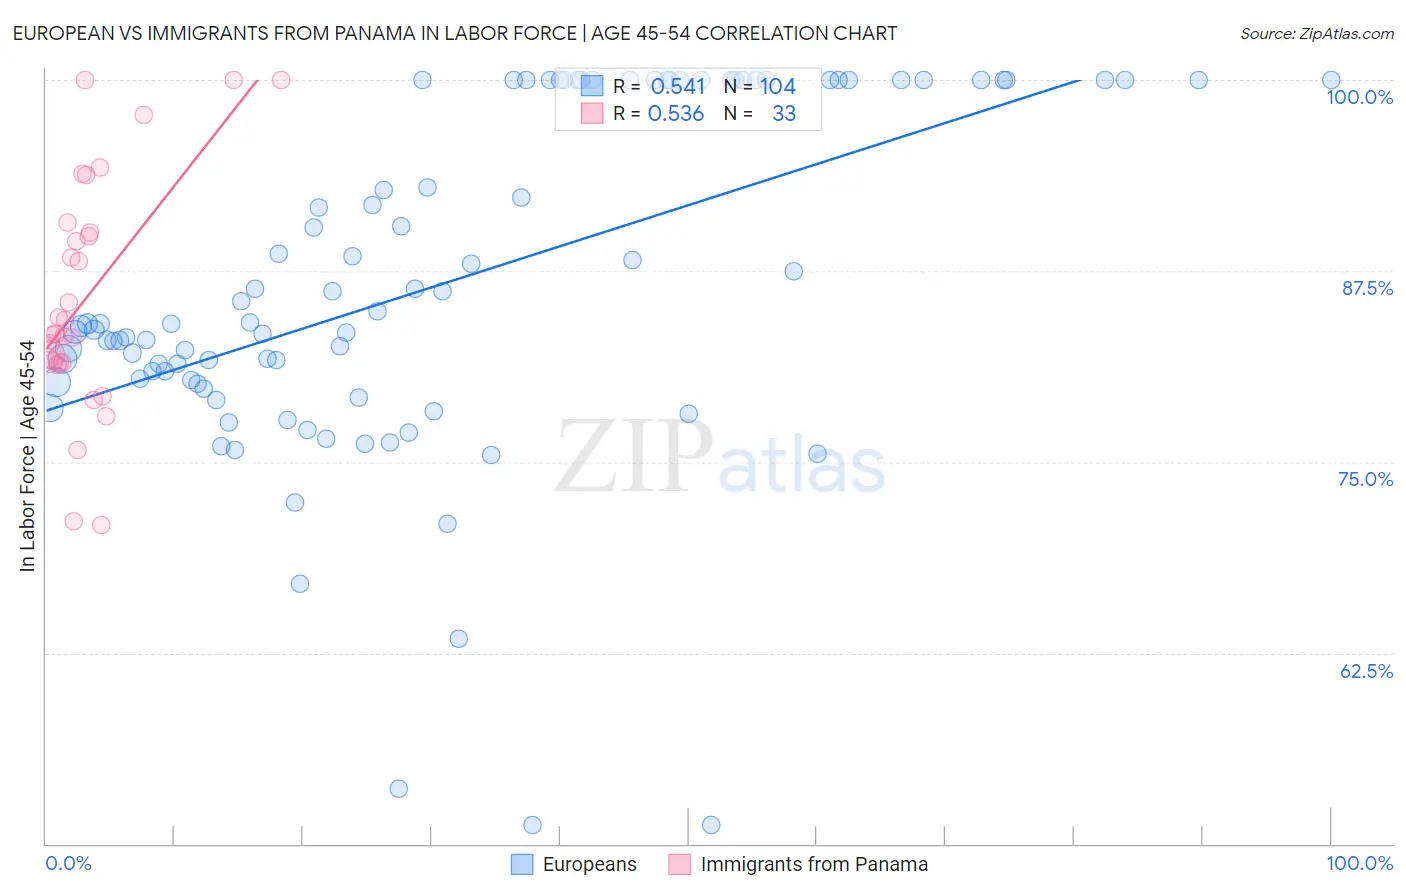
European vs Immigrants from Panama In Labor Force | Age 45-54 Correlation Chart

The statistical analysis conducted on geographies consisting of 561,134,108 people shows a substantial positive correlation between the proportion of Europeans and labor force participation rate among population between the ages 45 and 54 in the United States with a correlation coefficient (R) of 0.541 and weighted average of 82.6%. Similarly, the statistical analysis conducted on geographies consisting of 221,155,695 people shows a substantial positive correlation between the proportion of Immigrants from Panama and labor force participation rate among population between the ages 45 and 54 in the United States with a correlation coefficient (R) of 0.536 and weighted average of 82.2%, a difference of 0.46%.
European vs Immigrants from Panama In Labor Force | Age 45-54

In Labor Force | Age 45-54 Correlation Summary

MeasurementEuropeanImmigrants from Panama
Minimum51.2%70.9%
Maximum100.0%100.0%
Range48.8%29.1%
Mean86.7%85.8%
Median84.1%83.4%
Interquartile 25% (IQ1)80.3%81.5%
Interquartile 75% (IQ3)100.0%90.3%
Interquartile Range (IQR)19.7%8.9%
Standard Deviation (Sample)11.2%7.6%
Standard Deviation (Population)11.2%7.5%

Similar Demographics by In Labor Force | Age 45-54

Demographics Similar to Europeans by In Labor Force | Age 45-54

In terms of in labor force | age 45-54, the demographic groups most similar to Europeans are New Zealander (82.6%, a difference of 0.0%), Immigrants from England (82.6%, a difference of 0.0%), Immigrants from Hungary (82.7%, a difference of 0.040%), Irish (82.6%, a difference of 0.040%), and Hungarian (82.7%, a difference of 0.050%).
DemographicsRating | RankIn Labor Force | Age 45-54
Immigrants | Nicaragua
44.6
/100
|
#177
Average
82.7%
Nigerians
40.5
/100
|
#178
Average
82.7%
Immigrants | Switzerland
39.4
/100
|
#179
Fair
82.7%
Hungarians
38.0
/100
|
#180
Fair
82.7%
Israelis
37.7
/100
|
#181
Fair
82.7%
Immigrants | Hungary
37.1
/100
|
#182
Fair
82.7%
New Zealanders
32.7
/100
|
#183
Fair
82.6%
Europeans
32.6
/100
|
#184
Fair
82.6%
Immigrants | England
32.2
/100
|
#185
Fair
82.6%
Irish
29.2
/100
|
#186
Fair
82.6%
Immigrants | Costa Rica
28.3
/100
|
#187
Fair
82.6%
South Africans
28.0
/100
|
#188
Fair
82.6%
Syrians
26.0
/100
|
#189
Fair
82.6%
British
25.7
/100
|
#190
Fair
82.6%
Armenians
23.2
/100
|
#191
Fair
82.5%

Demographics Similar to Immigrants from Panama by In Labor Force | Age 45-54

In terms of in labor force | age 45-54, the demographic groups most similar to Immigrants from Panama are Iraqi (82.2%, a difference of 0.0%), Immigrants from Uzbekistan (82.3%, a difference of 0.010%), Scottish (82.2%, a difference of 0.010%), Ecuadorian (82.3%, a difference of 0.030%), and Immigrants from Syria (82.3%, a difference of 0.040%).
DemographicsRating | RankIn Labor Force | Age 45-54
Immigrants | Cabo Verde
8.6
/100
|
#207
Tragic
82.3%
Native Hawaiians
8.5
/100
|
#208
Tragic
82.3%
Immigrants | Lebanon
7.4
/100
|
#209
Tragic
82.3%
Immigrants | Bahamas
7.1
/100
|
#210
Tragic
82.3%
Immigrants | Syria
6.6
/100
|
#211
Tragic
82.3%
Ecuadorians
6.3
/100
|
#212
Tragic
82.3%
Immigrants | Uzbekistan
5.8
/100
|
#213
Tragic
82.3%
Immigrants | Panama
5.6
/100
|
#214
Tragic
82.2%
Iraqis
5.6
/100
|
#215
Tragic
82.2%
Scottish
5.3
/100
|
#216
Tragic
82.2%
Portuguese
4.7
/100
|
#217
Tragic
82.2%
English
4.4
/100
|
#218
Tragic
82.2%
French
4.1
/100
|
#219
Tragic
82.2%
Bahamians
3.6
/100
|
#220
Tragic
82.2%
Panamanians
3.5
/100
|
#221
Tragic
82.2%