Estonian vs Sioux In Labor Force | Age 20-24

COMPARE

Estonian
Race
Ancestry
AfghanAfricanAlaska NativeAlaskan AthabascanAlbanianAleutAlsatianAmericanApacheArabArapahoArgentineanArmenianAssyrian/Chaldean/SyriacAustralianAustrianBahamianBangladeshiBarbadianBasqueBelgianBelizeanBermudanBhutaneseBlackfeetBolivianBrazilianBritishBritish West IndianBulgarianBurmeseCajunCambodianCanadianCape VerdeanCarpatho RusynCelticCentral AmericanCentral American IndianCherokeeCheyenneChickasawChileanChineseChippewaChoctawColombianColvilleComancheCosta RicanCreeCreekCroatianCrowCubanCypriotCzechCzechoslovakianDanishDelawareDominicanDutchDutch West IndianEastern EuropeanEcuadorianEgyptianEnglishEstonianEthiopianEuropeanFijianFilipinoFinnishFrenchFrench American IndianFrench CanadianGermanGerman RussianGhanaianGreekGuamanian/ChamorroGuatemalanGuyaneseHaitianHmongHonduranHopiHoumaHungarianIcelanderIndian (Asian)IndonesianInupiatIranianIraqiIrishIroquoisIsraeliItalianJamaicanJapaneseJordanianKenyanKiowaKoreanLaotianLatvianLebaneseLiberianLithuanianLumbeeLuxembourgerMacedonianMalaysianMalteseMarshalleseMenomineeMexicanMexican American IndianMongolianMoroccanNative HawaiianNavajoNepaleseNew ZealanderNicaraguanNigerianNorthern EuropeanNorwegianOkinawanOsageOttawaPaiutePakistaniPalestinianPanamanianParaguayanPennsylvania GermanPeruvianPimaPolishPortuguesePotawatomiPuebloPuerto RicanPuget Sound SalishRomanianRussianSalvadoranSamoanScandinavianScotch-IrishScottishSeminoleSenegaleseSerbianShoshoneSierra LeoneanSlavicSlovakSloveneSomaliSouth AfricanSouth AmericanSouth American IndianSoviet UnionSpaniardSpanishSpanish AmericanSpanish American IndianSri LankanSubsaharan AfricanSudaneseSwedishSwissSyrianTaiwaneseThaiTlingit-HaidaTohono O'OdhamTonganTrinidadian and TobagonianTsimshianTurkishU.S. Virgin IslanderUgandanUkrainianUruguayanUteVenezuelanVietnameseWelshWest IndianYakamaYaquiYugoslavianYumanYup'ikZimbabwean
Immigration
NonimmigrantsImmigrantsAfghanistanAfricaAlbaniaArgentinaArmeniaAsiaAustraliaAustriaBahamasBangladeshBarbadosBelarusBelgiumBelizeBoliviaBosnia and HerzegovinaBrazilBulgariaBurma/MyanmarCabo VerdeCambodiaCameroonCanadaCaribbeanCentral AmericaChileChinaColombiaCongoCosta RicaCroatiaCubaCzechoslovakiaDenmarkDominicaDominican RepublicEastern AfricaEastern AsiaEastern EuropeEcuadorEgyptEl SalvadorEnglandEritreaEthiopiaEuropeFijiFranceGermanyGhanaGreeceGrenadaGuatemalaGuyanaHaitiHondurasHong KongHungaryIndiaIndonesiaIranIraqIrelandIsraelItalyJamaicaJapanJordanKazakhstanKenyaKoreaKuwaitLaosLatin AmericaLatviaLebanonLiberiaLithuaniaMalaysiaMexicoMicronesiaMiddle AfricaMoldovaMoroccoNepalNetherlandsNicaraguaNigeriaNorth AmericaNorth MacedoniaNorthern AfricaNorthern EuropeNorwayOceaniaPakistanPanamaPeruPhilippinesPolandPortugalRomaniaRussiaSaudi ArabiaScotlandSenegalSerbiaSierra LeoneSingaporeSomaliaSouth AfricaSouth AmericaSouth Central AsiaSouth Eastern AsiaSouthern EuropeSpainSri LankaSt. Vincent and the GrenadinesSudanSwedenSwitzerlandSyriaTaiwanThailandTrinidad and TobagoTurkeyUgandaUkraineUruguayUzbekistanVenezuelaVietnamWest IndiesWestern AfricaWestern AsiaWestern EuropeYemenZaireZimbabweAzores
Sioux
Race
Ancestry
AfghanAfricanAlaska NativeAlaskan AthabascanAlbanianAleutAlsatianAmericanApacheArabArapahoArgentineanArmenianAssyrian/Chaldean/SyriacAustralianAustrianBahamianBangladeshiBarbadianBasqueBelgianBelizeanBermudanBhutaneseBlackfeetBolivianBrazilianBritishBritish West IndianBulgarianBurmeseCajunCambodianCanadianCape VerdeanCarpatho RusynCelticCentral AmericanCentral American IndianCherokeeCheyenneChickasawChileanChineseChippewaChoctawColombianColvilleComancheCosta RicanCreeCreekCroatianCrowCubanCypriotCzechCzechoslovakianDanishDelawareDominicanDutchDutch West IndianEastern EuropeanEcuadorianEgyptianEnglishEthiopianEuropeanFijianFilipinoFinnishFrenchFrench American IndianFrench CanadianGermanGerman RussianGhanaianGreekGuamanian/ChamorroGuatemalanGuyaneseHaitianHmongHonduranHopiHoumaHungarianIcelanderIndian (Asian)IndonesianInupiatIranianIraqiIrishIroquoisIsraeliItalianJamaicanJapaneseJordanianKenyanKiowaKoreanLaotianLatvianLebaneseLiberianLithuanianLumbeeLuxembourgerMacedonianMalaysianMalteseMarshalleseMenomineeMexicanMexican American IndianMongolianMoroccanNative HawaiianNavajoNepaleseNew ZealanderNicaraguanNigerianNorthern EuropeanNorwegianOkinawanOsageOttawaPaiutePakistaniPalestinianPanamanianParaguayanPennsylvania GermanPeruvianPimaPolishPortuguesePotawatomiPuebloPuerto RicanPuget Sound SalishRomanianRussianSalvadoranSamoanScandinavianScotch-IrishScottishSeminoleSenegaleseSerbianShoshoneSierra LeoneanSiouxSlavicSlovakSloveneSomaliSouth AfricanSouth AmericanSouth American IndianSoviet UnionSpaniardSpanishSpanish AmericanSpanish American IndianSri LankanSubsaharan AfricanSudaneseSwedishSwissSyrianTaiwaneseThaiTlingit-HaidaTohono O'OdhamTonganTrinidadian and TobagonianTsimshianTurkishU.S. Virgin IslanderUgandanUkrainianUruguayanUteVenezuelanVietnameseWelshWest IndianYakamaYaquiYugoslavianYumanYup'ikZimbabwean
Immigration
NonimmigrantsImmigrantsAfghanistanAfricaAlbaniaArgentinaArmeniaAsiaAustraliaAustriaBahamasBangladeshBarbadosBelarusBelgiumBelizeBoliviaBosnia and HerzegovinaBrazilBulgariaBurma/MyanmarCabo VerdeCambodiaCameroonCanadaCaribbeanCentral AmericaChileChinaColombiaCongoCosta RicaCroatiaCubaCzechoslovakiaDenmarkDominicaDominican RepublicEastern AfricaEastern AsiaEastern EuropeEcuadorEgyptEl SalvadorEnglandEritreaEthiopiaEuropeFijiFranceGermanyGhanaGreeceGrenadaGuatemalaGuyanaHaitiHondurasHong KongHungaryIndiaIndonesiaIranIraqIrelandIsraelItalyJamaicaJapanJordanKazakhstanKenyaKoreaKuwaitLaosLatin AmericaLatviaLebanonLiberiaLithuaniaMalaysiaMexicoMicronesiaMiddle AfricaMoldovaMoroccoNepalNetherlandsNicaraguaNigeriaNorth AmericaNorth MacedoniaNorthern AfricaNorthern EuropeNorwayOceaniaPakistanPanamaPeruPhilippinesPolandPortugalRomaniaRussiaSaudi ArabiaScotlandSenegalSerbiaSierra LeoneSingaporeSomaliaSouth AfricaSouth AmericaSouth Central AsiaSouth Eastern AsiaSouthern EuropeSpainSri LankaSt. Vincent and the GrenadinesSudanSwedenSwitzerlandSyriaTaiwanThailandTrinidad and TobagoTurkeyUgandaUkraineUruguayUzbekistanVenezuelaVietnamWest IndiesWestern AfricaWestern AsiaWestern EuropeYemenZaireZimbabweAzores
In Labor Force | Age 20-24
Income
Poverty
Unemployment
Labor Participation
Family Structure
Vehicle Availability
Education Level
Disability

In Labor Force | Age 20-24 Comparison

Estonians

Sioux

Excellent
Poor
75.6%
IN LABOR FORCE | AGE 20-24
87.1/ 100
METRIC RATING
134th/ 347
METRIC RANK
74.6%
IN LABOR FORCE | AGE 20-24
17.5/ 100
METRIC RATING
206th/ 347
METRIC RANK

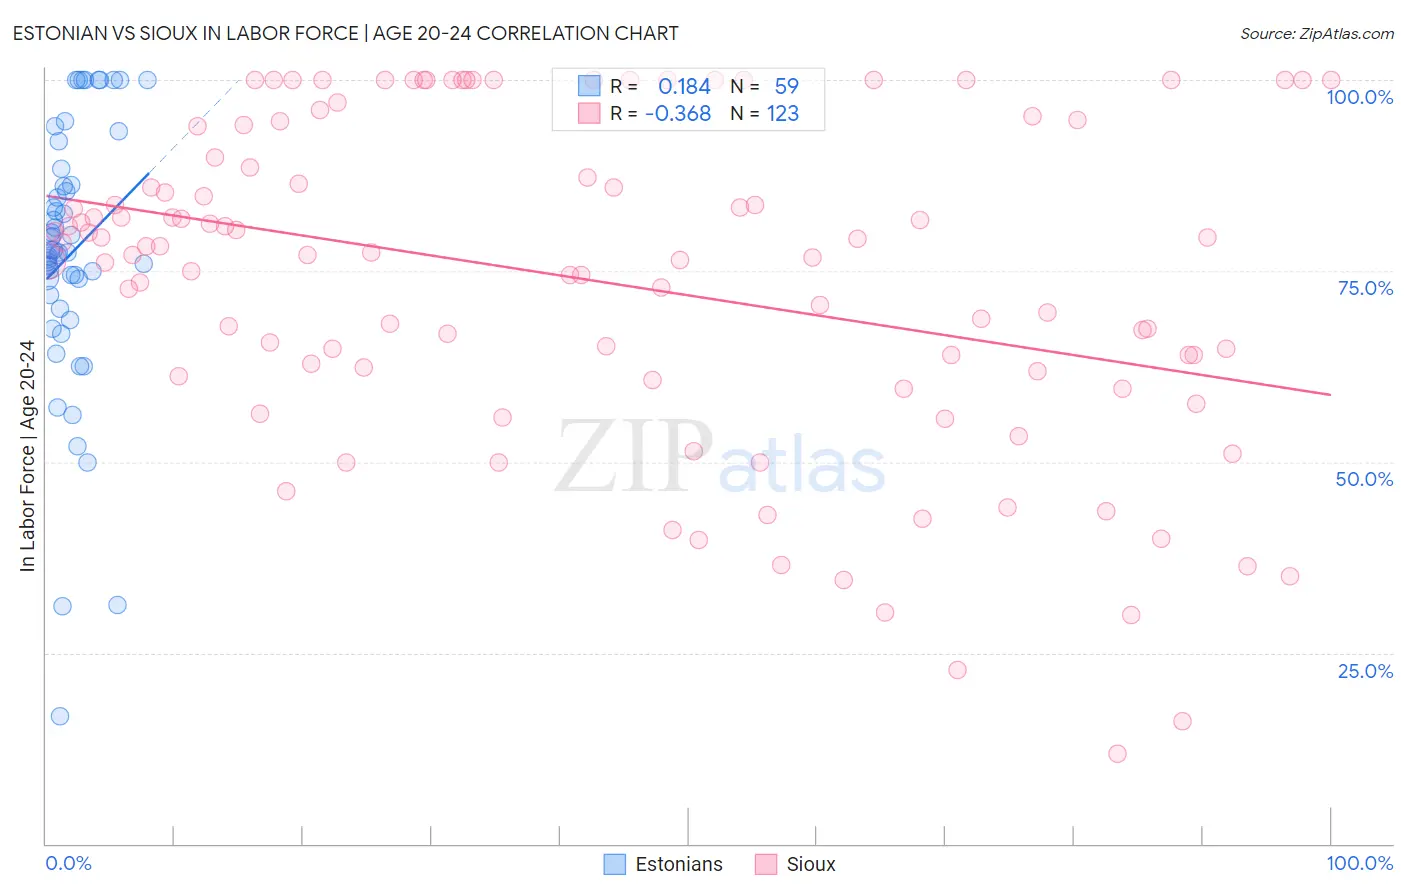
Estonian vs Sioux In Labor Force | Age 20-24 Correlation Chart

The statistical analysis conducted on geographies consisting of 123,512,369 people shows a poor positive correlation between the proportion of Estonians and labor force participation rate among population between the ages 20 and 24 in the United States with a correlation coefficient (R) of 0.184 and weighted average of 75.6%. Similarly, the statistical analysis conducted on geographies consisting of 234,099,226 people shows a mild negative correlation between the proportion of Sioux and labor force participation rate among population between the ages 20 and 24 in the United States with a correlation coefficient (R) of -0.368 and weighted average of 74.6%, a difference of 1.3%.
Estonian vs Sioux In Labor Force | Age 20-24

In Labor Force | Age 20-24 Correlation Summary

MeasurementEstonianSioux
Minimum16.7%11.8%
Maximum100.0%100.0%
Range83.3%88.2%
Mean77.2%73.8%
Median77.5%77.4%
Interquartile 25% (IQ1)71.9%61.2%
Interquartile 75% (IQ3)86.3%93.9%
Interquartile Range (IQR)14.4%32.7%
Standard Deviation (Sample)17.3%21.4%
Standard Deviation (Population)17.2%21.3%

Similar Demographics by In Labor Force | Age 20-24

Demographics Similar to Estonians by In Labor Force | Age 20-24

In terms of in labor force | age 20-24, the demographic groups most similar to Estonians are Zimbabwean (75.6%, a difference of 0.040%), Immigrants from Jordan (75.6%, a difference of 0.050%), Palestinian (75.6%, a difference of 0.050%), Yaqui (75.5%, a difference of 0.050%), and Immigrants from Austria (75.6%, a difference of 0.060%).
DemographicsRating | RankIn Labor Force | Age 20-24
Sub-Saharan Africans
90.9
/100
|
#127
Exceptional
75.7%
Immigrants | Afghanistan
89.4
/100
|
#128
Excellent
75.6%
Iroquois
89.1
/100
|
#129
Excellent
75.6%
Immigrants | Austria
88.8
/100
|
#130
Excellent
75.6%
Immigrants | Jordan
88.5
/100
|
#131
Excellent
75.6%
Palestinians
88.4
/100
|
#132
Excellent
75.6%
Zimbabweans
88.2
/100
|
#133
Excellent
75.6%
Estonians
87.1
/100
|
#134
Excellent
75.6%
Yaqui
85.5
/100
|
#135
Excellent
75.5%
Immigrants | Brazil
84.8
/100
|
#136
Excellent
75.5%
Jordanians
84.8
/100
|
#137
Excellent
75.5%
Australians
84.8
/100
|
#138
Excellent
75.5%
Immigrants | England
84.6
/100
|
#139
Excellent
75.5%
Delaware
84.5
/100
|
#140
Excellent
75.5%
Romanians
84.1
/100
|
#141
Excellent
75.5%

Demographics Similar to Sioux by In Labor Force | Age 20-24

In terms of in labor force | age 20-24, the demographic groups most similar to Sioux are Immigrants from Italy (74.6%, a difference of 0.0%), Inupiat (74.6%, a difference of 0.0%), Immigrants from Northern Africa (74.6%, a difference of 0.010%), Albanian (74.6%, a difference of 0.030%), and Immigrants from Uruguay (74.6%, a difference of 0.040%).
DemographicsRating | RankIn Labor Force | Age 20-24
Taiwanese
23.2
/100
|
#199
Fair
74.7%
Nigerians
21.9
/100
|
#200
Fair
74.7%
Choctaw
21.4
/100
|
#201
Fair
74.7%
Moroccans
20.4
/100
|
#202
Fair
74.7%
Immigrants | Northern Africa
17.9
/100
|
#203
Poor
74.6%
Immigrants | Italy
17.6
/100
|
#204
Poor
74.6%
Inupiat
17.6
/100
|
#205
Poor
74.6%
Sioux
17.5
/100
|
#206
Poor
74.6%
Albanians
16.2
/100
|
#207
Poor
74.6%
Immigrants | Uruguay
15.8
/100
|
#208
Poor
74.6%
Arabs
15.8
/100
|
#209
Poor
74.6%
Uruguayans
15.1
/100
|
#210
Poor
74.6%
Immigrants | Australia
14.7
/100
|
#211
Poor
74.6%
Creek
13.3
/100
|
#212
Poor
74.5%
Peruvians
13.3
/100
|
#213
Poor
74.5%