Ecuadorian vs Immigrants from England In Labor Force | Age 30-34

COMPARE

Ecuadorian
Race
Ancestry
AfghanAfricanAlaska NativeAlaskan AthabascanAlbanianAleutAlsatianAmericanApacheArabArapahoArgentineanArmenianAssyrian/Chaldean/SyriacAustralianAustrianBahamianBangladeshiBarbadianBasqueBelgianBelizeanBermudanBhutaneseBlackfeetBolivianBrazilianBritishBritish West IndianBulgarianBurmeseCajunCambodianCanadianCape VerdeanCarpatho RusynCelticCentral AmericanCentral American IndianCherokeeCheyenneChickasawChileanChineseChippewaChoctawColombianColvilleComancheCosta RicanCreeCreekCroatianCrowCubanCypriotCzechCzechoslovakianDanishDelawareDominicanDutchDutch West IndianEastern EuropeanEcuadorianEgyptianEnglishEstonianEthiopianEuropeanFijianFilipinoFinnishFrenchFrench American IndianFrench CanadianGermanGerman RussianGhanaianGreekGuamanian/ChamorroGuatemalanGuyaneseHaitianHmongHonduranHopiHoumaHungarianIcelanderIndian (Asian)IndonesianInupiatIranianIraqiIrishIroquoisIsraeliItalianJamaicanJapaneseJordanianKenyanKiowaKoreanLaotianLatvianLebaneseLiberianLithuanianLumbeeLuxembourgerMacedonianMalaysianMalteseMarshalleseMenomineeMexicanMexican American IndianMongolianMoroccanNative HawaiianNavajoNepaleseNew ZealanderNicaraguanNigerianNorthern EuropeanNorwegianOkinawanOsageOttawaPaiutePakistaniPalestinianPanamanianParaguayanPennsylvania GermanPeruvianPimaPolishPortuguesePotawatomiPuebloPuerto RicanPuget Sound SalishRomanianRussianSalvadoranSamoanScandinavianScotch-IrishScottishSeminoleSenegaleseSerbianShoshoneSierra LeoneanSiouxSlavicSlovakSloveneSomaliSouth AfricanSouth AmericanSouth American IndianSoviet UnionSpaniardSpanishSpanish AmericanSpanish American IndianSri LankanSubsaharan AfricanSudaneseSwedishSwissSyrianTaiwaneseThaiTlingit-HaidaTohono O'OdhamTonganTrinidadian and TobagonianTsimshianTurkishU.S. Virgin IslanderUgandanUkrainianUruguayanUteVenezuelanVietnameseWelshWest IndianYakamaYaquiYugoslavianYumanYup'ikZimbabwean
Immigration
NonimmigrantsImmigrantsAfghanistanAfricaAlbaniaArgentinaArmeniaAsiaAustraliaAustriaBahamasBangladeshBarbadosBelarusBelgiumBelizeBoliviaBosnia and HerzegovinaBrazilBulgariaBurma/MyanmarCabo VerdeCambodiaCameroonCanadaCaribbeanCentral AmericaChileChinaColombiaCongoCosta RicaCroatiaCubaCzechoslovakiaDenmarkDominicaDominican RepublicEastern AfricaEastern AsiaEastern EuropeEcuadorEgyptEl SalvadorEritreaEthiopiaEuropeFijiFranceGermanyGhanaGreeceGrenadaGuatemalaGuyanaHaitiHondurasHong KongHungaryIndiaIndonesiaIranIraqIrelandIsraelItalyJamaicaJapanJordanKazakhstanKenyaKoreaKuwaitLaosLatin AmericaLatviaLebanonLiberiaLithuaniaMalaysiaMexicoMicronesiaMiddle AfricaMoldovaMoroccoNepalNetherlandsNicaraguaNigeriaNorth AmericaNorth MacedoniaNorthern AfricaNorthern EuropeNorwayOceaniaPakistanPanamaPeruPhilippinesPolandPortugalRomaniaRussiaSaudi ArabiaScotlandSenegalSerbiaSierra LeoneSingaporeSomaliaSouth AfricaSouth AmericaSouth Central AsiaSouth Eastern AsiaSouthern EuropeSpainSri LankaSt. Vincent and the GrenadinesSudanSwedenSwitzerlandSyriaTaiwanThailandTrinidad and TobagoTurkeyUgandaUkraineUruguayUzbekistanVenezuelaVietnamWest IndiesWestern AfricaWestern AsiaWestern EuropeYemenZaireZimbabweAzores
Immigrants from England
Race
Ancestry
AfghanAfricanAlaska NativeAlaskan AthabascanAlbanianAleutAlsatianAmericanApacheArabArapahoArgentineanArmenianAssyrian/Chaldean/SyriacAustralianAustrianBahamianBangladeshiBarbadianBasqueBelgianBelizeanBermudanBhutaneseBlackfeetBolivianBrazilianBritishBritish West IndianBulgarianBurmeseCajunCambodianCanadianCape VerdeanCarpatho RusynCelticCentral AmericanCentral American IndianCherokeeCheyenneChickasawChileanChineseChippewaChoctawColombianColvilleComancheCosta RicanCreeCreekCroatianCrowCubanCypriotCzechCzechoslovakianDanishDelawareDominicanDutchDutch West IndianEastern EuropeanEgyptianEnglishEstonianEthiopianEuropeanFijianFilipinoFinnishFrenchFrench American IndianFrench CanadianGermanGerman RussianGhanaianGreekGuamanian/ChamorroGuatemalanGuyaneseHaitianHmongHonduranHopiHoumaHungarianIcelanderIndian (Asian)IndonesianInupiatIranianIraqiIrishIroquoisIsraeliItalianJamaicanJapaneseJordanianKenyanKiowaKoreanLaotianLatvianLebaneseLiberianLithuanianLumbeeLuxembourgerMacedonianMalaysianMalteseMarshalleseMenomineeMexicanMexican American IndianMongolianMoroccanNative HawaiianNavajoNepaleseNew ZealanderNicaraguanNigerianNorthern EuropeanNorwegianOkinawanOsageOttawaPaiutePakistaniPalestinianPanamanianParaguayanPennsylvania GermanPeruvianPimaPolishPortuguesePotawatomiPuebloPuerto RicanPuget Sound SalishRomanianRussianSalvadoranSamoanScandinavianScotch-IrishScottishSeminoleSenegaleseSerbianShoshoneSierra LeoneanSiouxSlavicSlovakSloveneSomaliSouth AfricanSouth AmericanSouth American IndianSoviet UnionSpaniardSpanishSpanish AmericanSpanish American IndianSri LankanSubsaharan AfricanSudaneseSwedishSwissSyrianTaiwaneseThaiTlingit-HaidaTohono O'OdhamTonganTrinidadian and TobagonianTsimshianTurkishU.S. Virgin IslanderUgandanUkrainianUruguayanUteVenezuelanVietnameseWelshWest IndianYakamaYaquiYugoslavianYumanYup'ikZimbabwean
Immigration
NonimmigrantsImmigrantsAfghanistanAfricaAlbaniaArgentinaArmeniaAsiaAustraliaAustriaBahamasBangladeshBarbadosBelarusBelgiumBelizeBoliviaBosnia and HerzegovinaBrazilBulgariaBurma/MyanmarCabo VerdeCambodiaCameroonCanadaCaribbeanCentral AmericaChileChinaColombiaCongoCosta RicaCroatiaCubaCzechoslovakiaDenmarkDominicaDominican RepublicEastern AfricaEastern AsiaEastern EuropeEcuadorEgyptEl SalvadorEnglandEritreaEthiopiaEuropeFijiFranceGermanyGhanaGreeceGrenadaGuatemalaGuyanaHaitiHondurasHong KongHungaryIndiaIndonesiaIranIraqIrelandIsraelItalyJamaicaJapanJordanKazakhstanKenyaKoreaKuwaitLaosLatin AmericaLatviaLebanonLiberiaLithuaniaMalaysiaMexicoMicronesiaMiddle AfricaMoldovaMoroccoNepalNetherlandsNicaraguaNigeriaNorth AmericaNorth MacedoniaNorthern AfricaNorthern EuropeNorwayOceaniaPakistanPanamaPeruPhilippinesPolandPortugalRomaniaRussiaSaudi ArabiaScotlandSenegalSerbiaSierra LeoneSingaporeSomaliaSouth AfricaSouth AmericaSouth Central AsiaSouth Eastern AsiaSouthern EuropeSpainSri LankaSt. Vincent and the GrenadinesSudanSwedenSwitzerlandSyriaTaiwanThailandTrinidad and TobagoTurkeyUgandaUkraineUruguayUzbekistanVenezuelaVietnamWest IndiesWestern AfricaWestern AsiaWestern EuropeYemenZaireZimbabweAzores
In Labor Force | Age 30-34
Income
Poverty
Unemployment
Labor Participation
Family Structure
Vehicle Availability
Education Level
Disability

In Labor Force | Age 30-34 Comparison

Ecuadorians

Immigrants from England

Poor
Average
84.4%
IN LABOR FORCE | AGE 30-34
14.2/ 100
METRIC RATING
204th/ 347
METRIC RANK
84.7%
IN LABOR FORCE | AGE 30-34
51.7/ 100
METRIC RATING
172nd/ 347
METRIC RANK

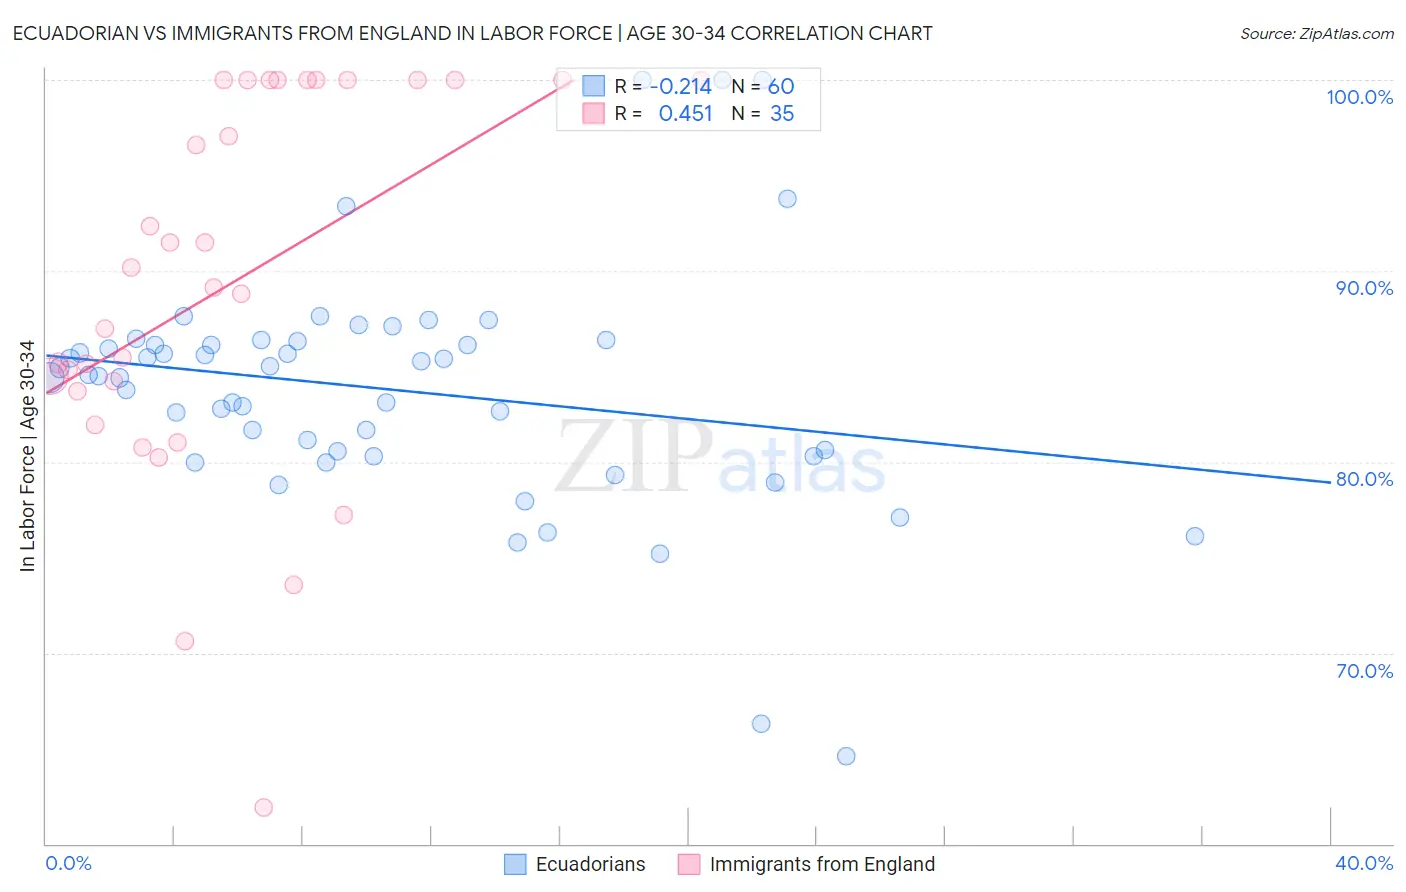
Ecuadorian vs Immigrants from England In Labor Force | Age 30-34 Correlation Chart

The statistical analysis conducted on geographies consisting of 317,665,283 people shows a weak negative correlation between the proportion of Ecuadorians and labor force participation rate among population between the ages 30 and 34 in the United States with a correlation coefficient (R) of -0.214 and weighted average of 84.4%. Similarly, the statistical analysis conducted on geographies consisting of 391,631,139 people shows a moderate positive correlation between the proportion of Immigrants from England and labor force participation rate among population between the ages 30 and 34 in the United States with a correlation coefficient (R) of 0.451 and weighted average of 84.7%, a difference of 0.33%.
Ecuadorian vs Immigrants from England In Labor Force | Age 30-34

In Labor Force | Age 30-34 Correlation Summary

MeasurementEcuadorianImmigrants from England
Minimum64.6%61.9%
Maximum100.0%100.0%
Range35.4%38.1%
Mean83.8%89.3%
Median84.5%89.1%
Interquartile 25% (IQ1)80.4%83.7%
Interquartile 75% (IQ3)86.2%100.0%
Interquartile Range (IQR)5.8%16.3%
Standard Deviation (Sample)6.3%9.9%
Standard Deviation (Population)6.2%9.7%

Similar Demographics by In Labor Force | Age 30-34

Demographics Similar to Ecuadorians by In Labor Force | Age 30-34

In terms of in labor force | age 30-34, the demographic groups most similar to Ecuadorians are French (84.4%, a difference of 0.010%), Canadian (84.4%, a difference of 0.020%), Trinidadian and Tobagonian (84.5%, a difference of 0.050%), Immigrants from West Indies (84.5%, a difference of 0.050%), and Immigrants from Thailand (84.5%, a difference of 0.060%).
DemographicsRating | RankIn Labor Force | Age 30-34
Immigrants | Syria
21.9
/100
|
#197
Fair
84.5%
Dutch
20.2
/100
|
#198
Fair
84.5%
Immigrants | Thailand
19.1
/100
|
#199
Poor
84.5%
Sub-Saharan Africans
19.0
/100
|
#200
Poor
84.5%
Trinidadians and Tobagonians
18.2
/100
|
#201
Poor
84.5%
Immigrants | West Indies
18.1
/100
|
#202
Poor
84.5%
Canadians
15.4
/100
|
#203
Poor
84.4%
Ecuadorians
14.2
/100
|
#204
Poor
84.4%
French
13.8
/100
|
#205
Poor
84.4%
Lebanese
10.6
/100
|
#206
Poor
84.4%
Bangladeshis
9.4
/100
|
#207
Tragic
84.3%
Arabs
8.9
/100
|
#208
Tragic
84.3%
Jamaicans
8.8
/100
|
#209
Tragic
84.3%
Indonesians
8.8
/100
|
#210
Tragic
84.3%
Japanese
8.8
/100
|
#211
Tragic
84.3%

Demographics Similar to Immigrants from England by In Labor Force | Age 30-34

In terms of in labor force | age 30-34, the demographic groups most similar to Immigrants from England are Immigrants from Peru (84.7%, a difference of 0.0%), South American Indian (84.7%, a difference of 0.0%), Immigrants from Burma/Myanmar (84.7%, a difference of 0.0%), Irish (84.7%, a difference of 0.0%), and Israeli (84.7%, a difference of 0.0%).
DemographicsRating | RankIn Labor Force | Age 30-34
Immigrants | Western Europe
56.7
/100
|
#165
Average
84.7%
Afghans
55.2
/100
|
#166
Average
84.7%
Immigrants | South Eastern Asia
54.2
/100
|
#167
Average
84.7%
Immigrants | Peru
52.4
/100
|
#168
Average
84.7%
South American Indians
52.1
/100
|
#169
Average
84.7%
Immigrants | Burma/Myanmar
52.0
/100
|
#170
Average
84.7%
Irish
52.0
/100
|
#171
Average
84.7%
Immigrants | England
51.7
/100
|
#172
Average
84.7%
Israelis
51.1
/100
|
#173
Average
84.7%
Finns
50.0
/100
|
#174
Average
84.7%
Immigrants | South America
50.0
/100
|
#175
Average
84.7%
Immigrants | Uzbekistan
49.1
/100
|
#176
Average
84.7%
Laotians
46.9
/100
|
#177
Average
84.7%
Okinawans
44.1
/100
|
#178
Average
84.6%
Immigrants | Nigeria
42.5
/100
|
#179
Average
84.6%