Eastern European vs Hispanic or Latino In Labor Force | Age 30-34
COMPARE
Eastern European
Hispanic or Latino
In Labor Force | Age 30-34
In Labor Force | Age 30-34 Comparison
Eastern Europeans
Hispanics or Latinos
85.7%
IN LABOR FORCE | AGE 30-34
99.9/ 100
METRIC RATING
39th/ 347
METRIC RANK
82.4%
IN LABOR FORCE | AGE 30-34
0.0/ 100
METRIC RATING
301st/ 347
METRIC RANK
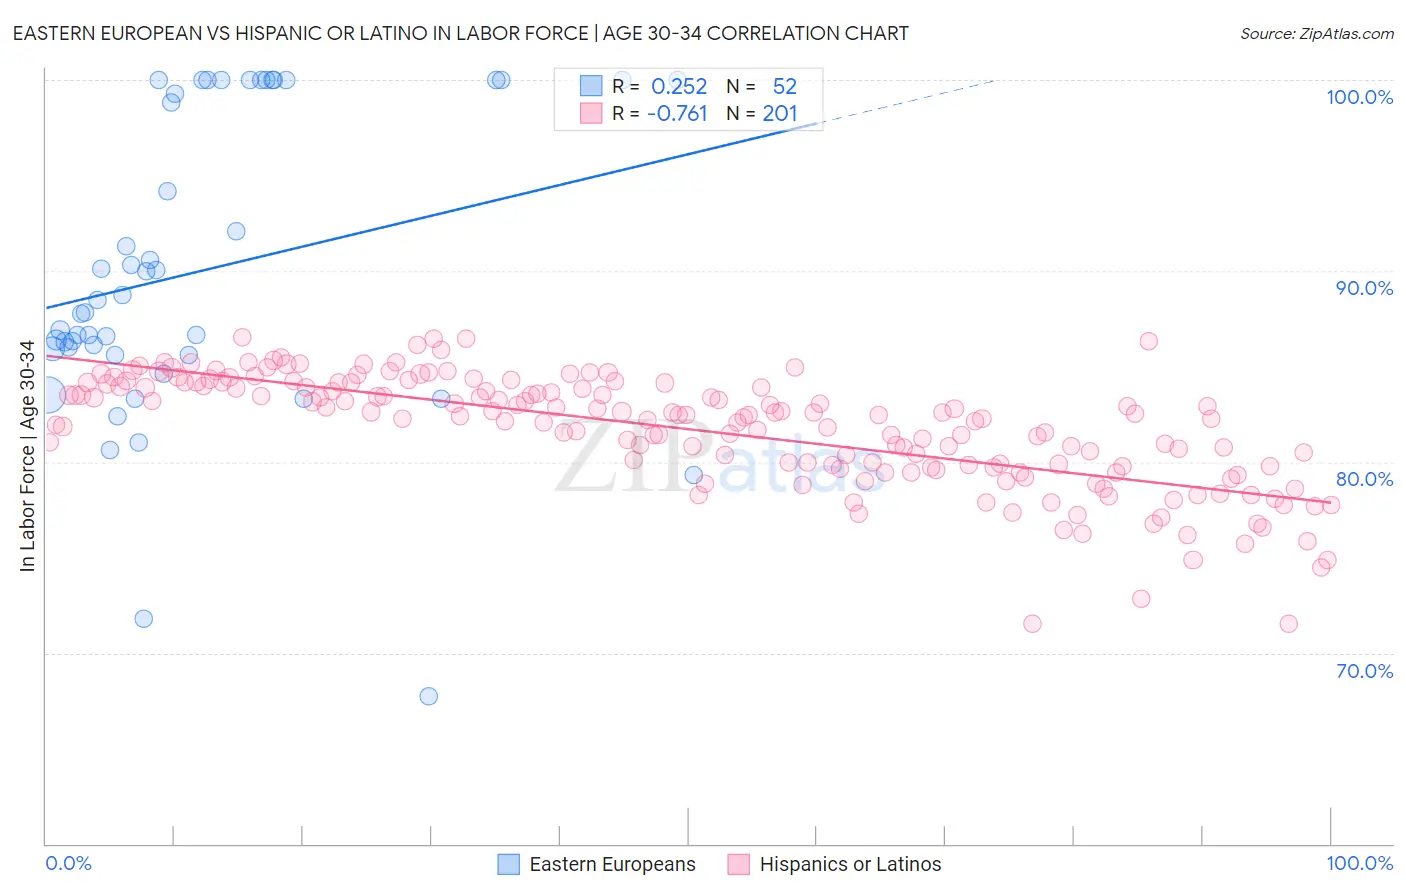
Eastern European vs Hispanic or Latino In Labor Force | Age 30-34 Correlation Chart
The statistical analysis conducted on geographies consisting of 460,851,415 people shows a weak positive correlation between the proportion of Eastern Europeans and labor force participation rate among population between the ages 30 and 34 in the United States with a correlation coefficient (R) of 0.252 and weighted average of 85.7%. Similarly, the statistical analysis conducted on geographies consisting of 576,977,639 people shows a strong negative correlation between the proportion of Hispanics or Latinos and labor force participation rate among population between the ages 30 and 34 in the United States with a correlation coefficient (R) of -0.761 and weighted average of 82.4%, a difference of 4.0%.
In Labor Force | Age 30-34 Correlation Summary
| Measurement | Eastern European | Hispanic or Latino |
| Minimum | 67.7% | 71.5% |
| Maximum | 100.0% | 86.5% |
| Range | 32.3% | 15.0% |
| Mean | 90.0% | 81.7% |
| Median | 88.2% | 82.4% |
| Interquartile 25% (IQ1) | 85.8% | 79.8% |
| Interquartile 75% (IQ3) | 100.0% | 84.0% |
| Interquartile Range (IQR) | 14.2% | 4.3% |
| Standard Deviation (Sample) | 7.9% | 2.9% |
| Standard Deviation (Population) | 7.8% | 2.9% |
Similar Demographics by In Labor Force | Age 30-34
Demographics Similar to Eastern Europeans by In Labor Force | Age 30-34
In terms of in labor force | age 30-34, the demographic groups most similar to Eastern Europeans are Immigrants from Greece (85.7%, a difference of 0.030%), Norwegian (85.7%, a difference of 0.040%), Turkish (85.7%, a difference of 0.040%), Serbian (85.8%, a difference of 0.050%), and Albanian (85.7%, a difference of 0.050%).
| Demographics | Rating | Rank | In Labor Force | Age 30-34 |
| Cypriots | 99.9 /100 | #32 | Exceptional 85.8% |
| Immigrants | Bosnia and Herzegovina | 99.9 /100 | #33 | Exceptional 85.8% |
| Ugandans | 99.9 /100 | #34 | Exceptional 85.8% |
| Serbians | 99.9 /100 | #35 | Exceptional 85.8% |
| Albanians | 99.9 /100 | #36 | Exceptional 85.7% |
| Norwegians | 99.9 /100 | #37 | Exceptional 85.7% |
| Immigrants | Greece | 99.9 /100 | #38 | Exceptional 85.7% |
| Eastern Europeans | 99.9 /100 | #39 | Exceptional 85.7% |
| Turks | 99.9 /100 | #40 | Exceptional 85.7% |
| Immigrants | Italy | 99.9 /100 | #41 | Exceptional 85.7% |
| Zimbabweans | 99.8 /100 | #42 | Exceptional 85.6% |
| Immigrants | Lithuania | 99.8 /100 | #43 | Exceptional 85.6% |
| Immigrants | Sri Lanka | 99.8 /100 | #44 | Exceptional 85.6% |
| Immigrants | Nepal | 99.8 /100 | #45 | Exceptional 85.6% |
| Immigrants | Morocco | 99.8 /100 | #46 | Exceptional 85.6% |
Demographics Similar to Hispanics or Latinos by In Labor Force | Age 30-34
In terms of in labor force | age 30-34, the demographic groups most similar to Hispanics or Latinos are Hmong (82.4%, a difference of 0.010%), Ottawa (82.4%, a difference of 0.030%), Immigrants from Micronesia (82.4%, a difference of 0.040%), Immigrants from Central America (82.5%, a difference of 0.070%), and Tlingit-Haida (82.3%, a difference of 0.12%).
| Demographics | Rating | Rank | In Labor Force | Age 30-34 |
| Americans | 0.0 /100 | #294 | Tragic 82.7% |
| Pennsylvania Germans | 0.0 /100 | #295 | Tragic 82.6% |
| Chippewa | 0.0 /100 | #296 | Tragic 82.6% |
| Comanche | 0.0 /100 | #297 | Tragic 82.6% |
| Aleuts | 0.0 /100 | #298 | Tragic 82.6% |
| Immigrants | Central America | 0.0 /100 | #299 | Tragic 82.5% |
| Hmong | 0.0 /100 | #300 | Tragic 82.4% |
| Hispanics or Latinos | 0.0 /100 | #301 | Tragic 82.4% |
| Ottawa | 0.0 /100 | #302 | Tragic 82.4% |
| Immigrants | Micronesia | 0.0 /100 | #303 | Tragic 82.4% |
| Tlingit-Haida | 0.0 /100 | #304 | Tragic 82.3% |
| Osage | 0.0 /100 | #305 | Tragic 82.3% |
| Spanish American Indians | 0.0 /100 | #306 | Tragic 82.2% |
| Menominee | 0.0 /100 | #307 | Tragic 82.2% |
| Puget Sound Salish | 0.0 /100 | #308 | Tragic 82.1% |