Dominican vs Immigrants from India In Labor Force | Age 20-64

COMPARE

Dominican
Race
Ancestry
AfghanAfricanAlaska NativeAlaskan AthabascanAlbanianAleutAlsatianAmericanApacheArabArapahoArgentineanArmenianAssyrian/Chaldean/SyriacAustralianAustrianBahamianBangladeshiBarbadianBasqueBelgianBelizeanBermudanBhutaneseBlackfeetBolivianBrazilianBritishBritish West IndianBulgarianBurmeseCajunCambodianCanadianCape VerdeanCarpatho RusynCelticCentral AmericanCentral American IndianCherokeeCheyenneChickasawChileanChineseChippewaChoctawColombianColvilleComancheCosta RicanCreeCreekCroatianCrowCubanCypriotCzechCzechoslovakianDanishDelawareDominicanDutchDutch West IndianEastern EuropeanEcuadorianEgyptianEnglishEstonianEthiopianEuropeanFijianFilipinoFinnishFrenchFrench American IndianFrench CanadianGermanGerman RussianGhanaianGreekGuamanian/ChamorroGuatemalanGuyaneseHaitianHmongHonduranHopiHoumaHungarianIcelanderIndian (Asian)IndonesianInupiatIranianIraqiIrishIroquoisIsraeliItalianJamaicanJapaneseJordanianKenyanKiowaKoreanLaotianLatvianLebaneseLiberianLithuanianLumbeeLuxembourgerMacedonianMalaysianMalteseMarshalleseMenomineeMexicanMexican American IndianMongolianMoroccanNative HawaiianNavajoNepaleseNew ZealanderNicaraguanNigerianNorthern EuropeanNorwegianOkinawanOsageOttawaPaiutePakistaniPalestinianPanamanianParaguayanPennsylvania GermanPeruvianPimaPolishPortuguesePotawatomiPuebloPuerto RicanPuget Sound SalishRomanianRussianSalvadoranSamoanScandinavianScotch-IrishScottishSeminoleSenegaleseSerbianShoshoneSierra LeoneanSiouxSlavicSlovakSloveneSomaliSouth AfricanSouth AmericanSouth American IndianSoviet UnionSpaniardSpanishSpanish AmericanSpanish American IndianSri LankanSubsaharan AfricanSudaneseSwedishSwissSyrianTaiwaneseThaiTlingit-HaidaTohono O'OdhamTonganTrinidadian and TobagonianTsimshianTurkishU.S. Virgin IslanderUgandanUkrainianUruguayanUteVenezuelanVietnameseWelshWest IndianYakamaYaquiYugoslavianYumanYup'ikZimbabwean
Immigration
NonimmigrantsImmigrantsAfghanistanAfricaAlbaniaArgentinaArmeniaAsiaAustraliaAustriaBahamasBangladeshBarbadosBelarusBelgiumBelizeBoliviaBosnia and HerzegovinaBrazilBulgariaBurma/MyanmarCabo VerdeCambodiaCameroonCanadaCaribbeanCentral AmericaChileChinaColombiaCongoCosta RicaCroatiaCubaCzechoslovakiaDenmarkDominicaDominican RepublicEastern AfricaEastern AsiaEastern EuropeEcuadorEgyptEl SalvadorEnglandEritreaEthiopiaEuropeFijiFranceGermanyGhanaGreeceGrenadaGuatemalaGuyanaHaitiHondurasHong KongHungaryIndonesiaIranIraqIrelandIsraelItalyJamaicaJapanJordanKazakhstanKenyaKoreaKuwaitLaosLatin AmericaLatviaLebanonLiberiaLithuaniaMalaysiaMexicoMicronesiaMiddle AfricaMoldovaMoroccoNepalNetherlandsNicaraguaNigeriaNorth AmericaNorth MacedoniaNorthern AfricaNorthern EuropeNorwayOceaniaPakistanPanamaPeruPhilippinesPolandPortugalRomaniaRussiaSaudi ArabiaScotlandSenegalSerbiaSierra LeoneSingaporeSomaliaSouth AfricaSouth AmericaSouth Central AsiaSouth Eastern AsiaSouthern EuropeSpainSri LankaSt. Vincent and the GrenadinesSudanSwedenSwitzerlandSyriaTaiwanThailandTrinidad and TobagoTurkeyUgandaUkraineUruguayUzbekistanVenezuelaVietnamWest IndiesWestern AfricaWestern AsiaWestern EuropeYemenZaireZimbabweAzores
Immigrants from India
Race
Ancestry
AfghanAfricanAlaska NativeAlaskan AthabascanAlbanianAleutAlsatianAmericanApacheArabArapahoArgentineanArmenianAssyrian/Chaldean/SyriacAustralianAustrianBahamianBangladeshiBarbadianBasqueBelgianBelizeanBermudanBhutaneseBlackfeetBolivianBrazilianBritishBritish West IndianBulgarianBurmeseCajunCambodianCanadianCape VerdeanCarpatho RusynCelticCentral AmericanCentral American IndianCherokeeCheyenneChickasawChileanChineseChippewaChoctawColombianColvilleComancheCosta RicanCreeCreekCroatianCrowCubanCypriotCzechCzechoslovakianDanishDelawareDutchDutch West IndianEastern EuropeanEcuadorianEgyptianEnglishEstonianEthiopianEuropeanFijianFilipinoFinnishFrenchFrench American IndianFrench CanadianGermanGerman RussianGhanaianGreekGuamanian/ChamorroGuatemalanGuyaneseHaitianHmongHonduranHopiHoumaHungarianIcelanderIndian (Asian)IndonesianInupiatIranianIraqiIrishIroquoisIsraeliItalianJamaicanJapaneseJordanianKenyanKiowaKoreanLaotianLatvianLebaneseLiberianLithuanianLumbeeLuxembourgerMacedonianMalaysianMalteseMarshalleseMenomineeMexicanMexican American IndianMongolianMoroccanNative HawaiianNavajoNepaleseNew ZealanderNicaraguanNigerianNorthern EuropeanNorwegianOkinawanOsageOttawaPaiutePakistaniPalestinianPanamanianParaguayanPennsylvania GermanPeruvianPimaPolishPortuguesePotawatomiPuebloPuerto RicanPuget Sound SalishRomanianRussianSalvadoranSamoanScandinavianScotch-IrishScottishSeminoleSenegaleseSerbianShoshoneSierra LeoneanSiouxSlavicSlovakSloveneSomaliSouth AfricanSouth AmericanSouth American IndianSoviet UnionSpaniardSpanishSpanish AmericanSpanish American IndianSri LankanSubsaharan AfricanSudaneseSwedishSwissSyrianTaiwaneseThaiTlingit-HaidaTohono O'OdhamTonganTrinidadian and TobagonianTsimshianTurkishU.S. Virgin IslanderUgandanUkrainianUruguayanUteVenezuelanVietnameseWelshWest IndianYakamaYaquiYugoslavianYumanYup'ikZimbabwean
Immigration
NonimmigrantsImmigrantsAfghanistanAfricaAlbaniaArgentinaArmeniaAsiaAustraliaAustriaBahamasBangladeshBarbadosBelarusBelgiumBelizeBoliviaBosnia and HerzegovinaBrazilBulgariaBurma/MyanmarCabo VerdeCambodiaCameroonCanadaCaribbeanCentral AmericaChileChinaColombiaCongoCosta RicaCroatiaCubaCzechoslovakiaDenmarkDominicaDominican RepublicEastern AfricaEastern AsiaEastern EuropeEcuadorEgyptEl SalvadorEnglandEritreaEthiopiaEuropeFijiFranceGermanyGhanaGreeceGrenadaGuatemalaGuyanaHaitiHondurasHong KongHungaryIndiaIndonesiaIranIraqIrelandIsraelItalyJamaicaJapanJordanKazakhstanKenyaKoreaKuwaitLaosLatin AmericaLatviaLebanonLiberiaLithuaniaMalaysiaMexicoMicronesiaMiddle AfricaMoldovaMoroccoNepalNetherlandsNicaraguaNigeriaNorth AmericaNorth MacedoniaNorthern AfricaNorthern EuropeNorwayOceaniaPakistanPanamaPeruPhilippinesPolandPortugalRomaniaRussiaSaudi ArabiaScotlandSenegalSerbiaSierra LeoneSingaporeSomaliaSouth AfricaSouth AmericaSouth Central AsiaSouth Eastern AsiaSouthern EuropeSpainSri LankaSt. Vincent and the GrenadinesSudanSwedenSwitzerlandSyriaTaiwanThailandTrinidad and TobagoTurkeyUgandaUkraineUruguayUzbekistanVenezuelaVietnamWest IndiesWestern AfricaWestern AsiaWestern EuropeYemenZaireZimbabweAzores
In Labor Force | Age 20-64
Income
Poverty
Unemployment
Labor Participation
Family Structure
Vehicle Availability
Education Level
Disability

In Labor Force | Age 20-64 Comparison

Dominicans

Immigrants from India

Tragic
Exceptional
77.7%
IN LABOR FORCE | AGE 20-64
0.0/ 100
METRIC RATING
297th/ 347
METRIC RANK
81.3%
IN LABOR FORCE | AGE 20-64
100.0/ 100
METRIC RATING
13th/ 347
METRIC RANK

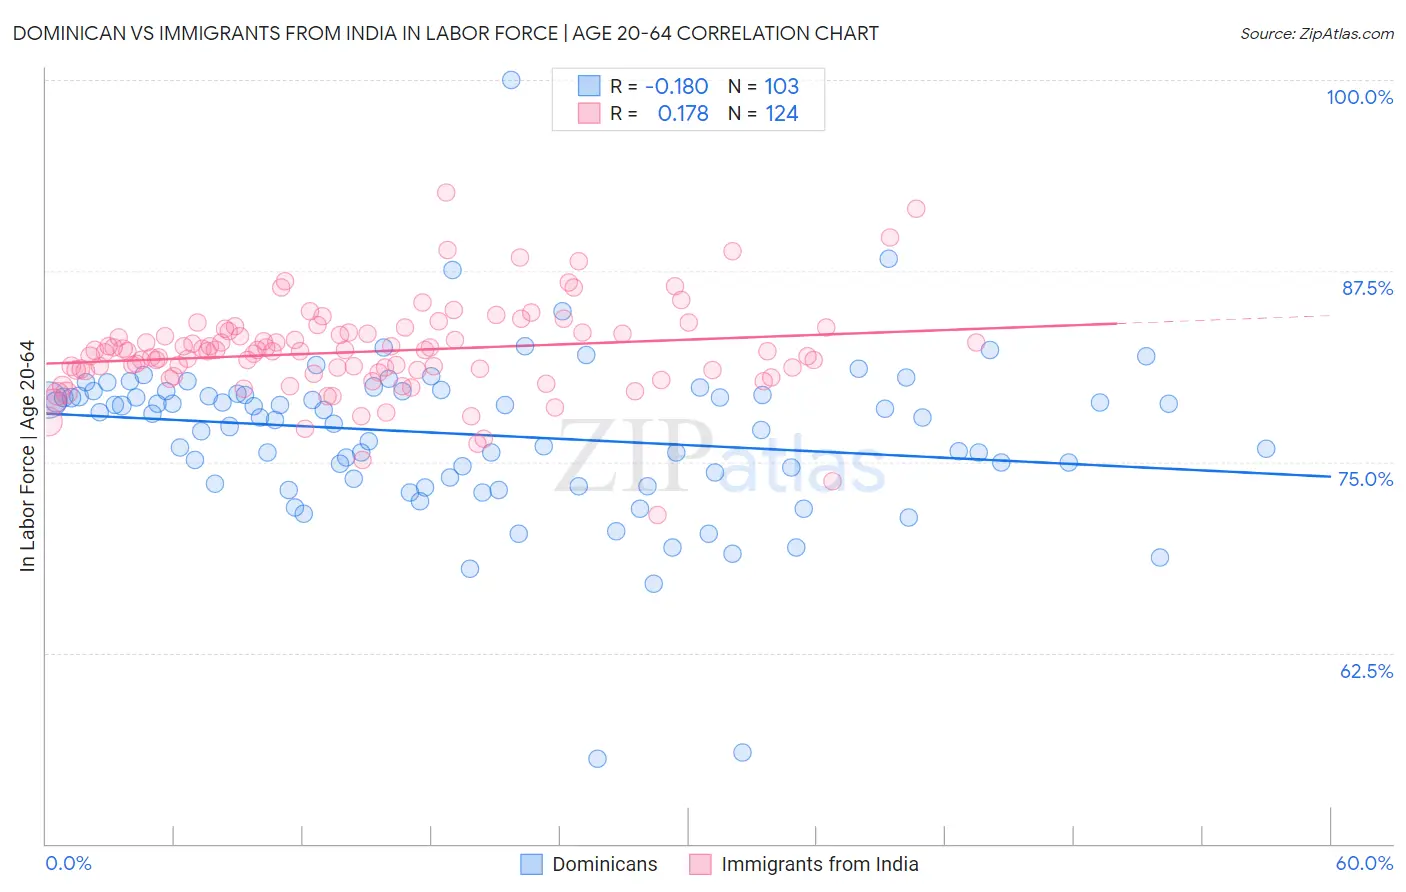
Dominican vs Immigrants from India In Labor Force | Age 20-64 Correlation Chart

The statistical analysis conducted on geographies consisting of 355,150,221 people shows a poor negative correlation between the proportion of Dominicans and labor force participation rate among population between the ages 20 and 64 in the United States with a correlation coefficient (R) of -0.180 and weighted average of 77.7%. Similarly, the statistical analysis conducted on geographies consisting of 434,133,401 people shows a poor positive correlation between the proportion of Immigrants from India and labor force participation rate among population between the ages 20 and 64 in the United States with a correlation coefficient (R) of 0.178 and weighted average of 81.3%, a difference of 4.6%.
Dominican vs Immigrants from India In Labor Force | Age 20-64

In Labor Force | Age 20-64 Correlation Summary

MeasurementDominicanImmigrants from India
Minimum55.6%71.5%
Maximum100.0%92.6%
Range44.4%21.1%
Mean76.8%82.2%
Median77.9%82.3%
Interquartile 25% (IQ1)73.9%80.9%
Interquartile 75% (IQ3)79.5%83.5%
Interquartile Range (IQR)5.6%2.6%
Standard Deviation (Sample)5.5%3.1%
Standard Deviation (Population)5.4%3.1%

Similar Demographics by In Labor Force | Age 20-64

Demographics Similar to Dominicans by In Labor Force | Age 20-64

In terms of in labor force | age 20-64, the demographic groups most similar to Dominicans are Immigrants from Dominican Republic (77.7%, a difference of 0.010%), Cree (77.7%, a difference of 0.010%), Immigrants from Grenada (77.7%, a difference of 0.040%), Immigrants from Central America (77.7%, a difference of 0.070%), and Hispanic or Latino (77.6%, a difference of 0.070%).
DemographicsRating | RankIn Labor Force | Age 20-64
Immigrants | Bangladesh
0.0
/100
|
#290
Tragic
77.9%
Spanish Americans
0.0
/100
|
#291
Tragic
77.8%
Immigrants | Azores
0.0
/100
|
#292
Tragic
77.8%
Delaware
0.0
/100
|
#293
Tragic
77.8%
Immigrants | Central America
0.0
/100
|
#294
Tragic
77.7%
Immigrants | Grenada
0.0
/100
|
#295
Tragic
77.7%
Immigrants | Dominican Republic
0.0
/100
|
#296
Tragic
77.7%
Dominicans
0.0
/100
|
#297
Tragic
77.7%
Cree
0.0
/100
|
#298
Tragic
77.7%
Hispanics or Latinos
0.0
/100
|
#299
Tragic
77.6%
Spanish American Indians
0.0
/100
|
#300
Tragic
77.6%
Nepalese
0.0
/100
|
#301
Tragic
77.5%
Iroquois
0.0
/100
|
#302
Tragic
77.5%
Chippewa
0.0
/100
|
#303
Tragic
77.3%
Immigrants | Mexico
0.0
/100
|
#304
Tragic
77.3%

Demographics Similar to Immigrants from India by In Labor Force | Age 20-64

In terms of in labor force | age 20-64, the demographic groups most similar to Immigrants from India are Immigrants from Eritrea (81.3%, a difference of 0.030%), Immigrants from Eastern Africa (81.3%, a difference of 0.060%), Cambodian (81.1%, a difference of 0.24%), Immigrants from Sierra Leone (81.5%, a difference of 0.25%), and Bulgarian (81.1%, a difference of 0.25%).
DemographicsRating | RankIn Labor Force | Age 20-64
Somalis
100.0
/100
|
#6
Exceptional
81.6%
Immigrants | Cameroon
100.0
/100
|
#7
Exceptional
81.6%
Immigrants | Somalia
100.0
/100
|
#8
Exceptional
81.6%
Sierra Leoneans
100.0
/100
|
#9
Exceptional
81.5%
Immigrants | Sierra Leone
100.0
/100
|
#10
Exceptional
81.5%
Immigrants | Eastern Africa
100.0
/100
|
#11
Exceptional
81.3%
Immigrants | Eritrea
100.0
/100
|
#12
Exceptional
81.3%
Immigrants | India
100.0
/100
|
#13
Exceptional
81.3%
Cambodians
100.0
/100
|
#14
Exceptional
81.1%
Bulgarians
100.0
/100
|
#15
Exceptional
81.1%
Immigrants | Nepal
100.0
/100
|
#16
Exceptional
81.1%
Norwegians
100.0
/100
|
#17
Exceptional
81.0%
Immigrants | Bulgaria
100.0
/100
|
#18
Exceptional
81.0%
Zimbabweans
100.0
/100
|
#19
Exceptional
81.0%
Thais
100.0
/100
|
#20
Exceptional
80.9%