Delaware vs Iraqi In Labor Force | Age 25-29
COMPARE
Delaware
Iraqi
In Labor Force | Age 25-29
In Labor Force | Age 25-29 Comparison
Delaware
Iraqis
83.7%
IN LABOR FORCE | AGE 25-29
0.2/ 100
METRIC RATING
257th/ 347
METRIC RANK
83.9%
IN LABOR FORCE | AGE 25-29
0.9/ 100
METRIC RATING
235th/ 347
METRIC RANK
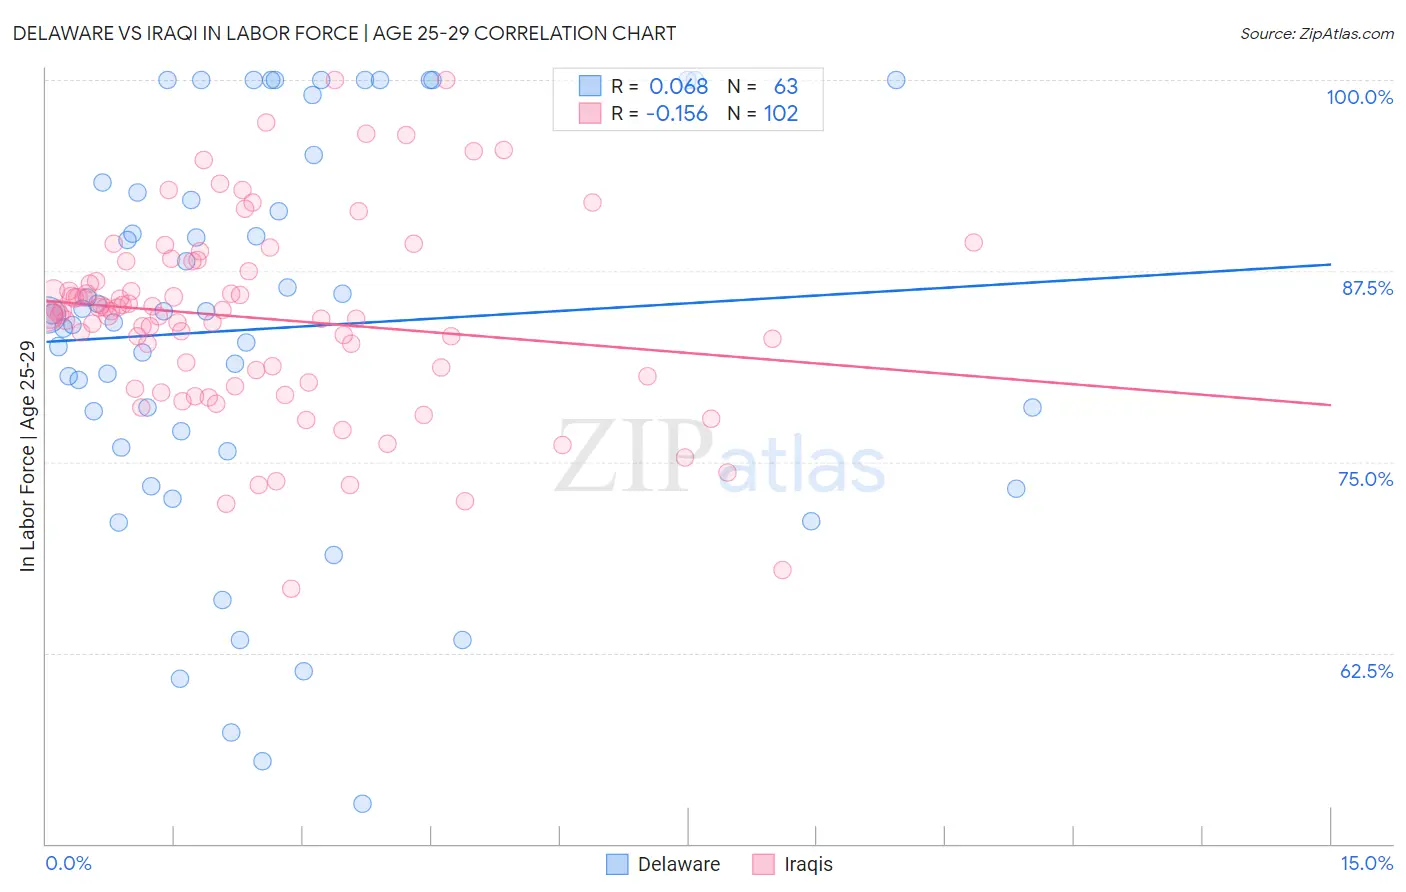
Delaware vs Iraqi In Labor Force | Age 25-29 Correlation Chart
The statistical analysis conducted on geographies consisting of 96,226,507 people shows a slight positive correlation between the proportion of Delaware and labor force participation rate among population between the ages 25 and 29 in the United States with a correlation coefficient (R) of 0.068 and weighted average of 83.7%. Similarly, the statistical analysis conducted on geographies consisting of 170,636,038 people shows a poor negative correlation between the proportion of Iraqis and labor force participation rate among population between the ages 25 and 29 in the United States with a correlation coefficient (R) of -0.156 and weighted average of 83.9%, a difference of 0.32%.
In Labor Force | Age 25-29 Correlation Summary
| Measurement | Delaware | Iraqi |
| Minimum | 52.6% | 66.7% |
| Maximum | 100.0% | 100.0% |
| Range | 47.4% | 33.3% |
| Mean | 83.7% | 84.4% |
| Median | 84.7% | 84.8% |
| Interquartile 25% (IQ1) | 75.9% | 80.6% |
| Interquartile 75% (IQ3) | 93.3% | 87.5% |
| Interquartile Range (IQR) | 17.4% | 6.9% |
| Standard Deviation (Sample) | 12.8% | 6.3% |
| Standard Deviation (Population) | 12.7% | 6.3% |
Similar Demographics by In Labor Force | Age 25-29
Demographics Similar to Delaware by In Labor Force | Age 25-29
In terms of in labor force | age 25-29, the demographic groups most similar to Delaware are Immigrants from Haiti (83.7%, a difference of 0.010%), Haitian (83.7%, a difference of 0.020%), Guatemalan (83.7%, a difference of 0.030%), Immigrants from Trinidad and Tobago (83.7%, a difference of 0.030%), and Spaniard (83.7%, a difference of 0.030%).
| Demographics | Rating | Rank | In Labor Force | Age 25-29 |
| Central Americans | 0.2 /100 | #250 | Tragic 83.7% |
| Bahamians | 0.2 /100 | #251 | Tragic 83.7% |
| Guatemalans | 0.2 /100 | #252 | Tragic 83.7% |
| Immigrants | Trinidad and Tobago | 0.2 /100 | #253 | Tragic 83.7% |
| Spaniards | 0.2 /100 | #254 | Tragic 83.7% |
| Haitians | 0.2 /100 | #255 | Tragic 83.7% |
| Immigrants | Haiti | 0.2 /100 | #256 | Tragic 83.7% |
| Delaware | 0.2 /100 | #257 | Tragic 83.7% |
| Immigrants | Guatemala | 0.1 /100 | #258 | Tragic 83.6% |
| Spanish | 0.1 /100 | #259 | Tragic 83.6% |
| Immigrants | Bahamas | 0.1 /100 | #260 | Tragic 83.6% |
| Pennsylvania Germans | 0.1 /100 | #261 | Tragic 83.6% |
| Immigrants | Fiji | 0.1 /100 | #262 | Tragic 83.6% |
| West Indians | 0.1 /100 | #263 | Tragic 83.5% |
| Puget Sound Salish | 0.1 /100 | #264 | Tragic 83.5% |
Demographics Similar to Iraqis by In Labor Force | Age 25-29
In terms of in labor force | age 25-29, the demographic groups most similar to Iraqis are Guamanian/Chamorro (83.9%, a difference of 0.0%), Immigrants (83.9%, a difference of 0.010%), Barbadian (83.9%, a difference of 0.020%), Immigrants from Uzbekistan (83.9%, a difference of 0.030%), and Jamaican (83.9%, a difference of 0.040%).
| Demographics | Rating | Rank | In Labor Force | Age 25-29 |
| Immigrants | Panama | 5.5 /100 | #228 | Tragic 84.2% |
| Immigrants | Oceania | 5.0 /100 | #229 | Tragic 84.2% |
| Whites/Caucasians | 4.8 /100 | #230 | Tragic 84.2% |
| Immigrants | Philippines | 4.7 /100 | #231 | Tragic 84.2% |
| Panamanians | 4.5 /100 | #232 | Tragic 84.2% |
| Immigrants | Western Asia | 2.7 /100 | #233 | Tragic 84.1% |
| Barbadians | 1.0 /100 | #234 | Tragic 83.9% |
| Iraqis | 0.9 /100 | #235 | Tragic 83.9% |
| Guamanians/Chamorros | 0.9 /100 | #236 | Tragic 83.9% |
| Immigrants | Immigrants | 0.9 /100 | #237 | Tragic 83.9% |
| Immigrants | Uzbekistan | 0.8 /100 | #238 | Tragic 83.9% |
| Jamaicans | 0.8 /100 | #239 | Tragic 83.9% |
| Trinidadians and Tobagonians | 0.7 /100 | #240 | Tragic 83.9% |
| Alsatians | 0.7 /100 | #241 | Tragic 83.9% |
| U.S. Virgin Islanders | 0.6 /100 | #242 | Tragic 83.8% |