Delaware vs Immigrants from South America In Labor Force | Age 20-24

COMPARE

Delaware
Race
Ancestry
AfghanAfricanAlaska NativeAlaskan AthabascanAlbanianAleutAlsatianAmericanApacheArabArapahoArgentineanArmenianAssyrian/Chaldean/SyriacAustralianAustrianBahamianBangladeshiBarbadianBasqueBelgianBelizeanBermudanBhutaneseBlackfeetBolivianBrazilianBritishBritish West IndianBulgarianBurmeseCajunCambodianCanadianCape VerdeanCarpatho RusynCelticCentral AmericanCentral American IndianCherokeeCheyenneChickasawChileanChineseChippewaChoctawColombianColvilleComancheCosta RicanCreeCreekCroatianCrowCubanCypriotCzechCzechoslovakianDanishDelawareDominicanDutchDutch West IndianEastern EuropeanEcuadorianEgyptianEnglishEstonianEthiopianEuropeanFijianFilipinoFinnishFrenchFrench American IndianFrench CanadianGermanGerman RussianGhanaianGreekGuamanian/ChamorroGuatemalanGuyaneseHaitianHmongHonduranHopiHoumaHungarianIcelanderIndian (Asian)IndonesianInupiatIranianIraqiIrishIroquoisIsraeliItalianJamaicanJapaneseJordanianKenyanKiowaKoreanLaotianLatvianLebaneseLiberianLithuanianLumbeeLuxembourgerMacedonianMalaysianMalteseMarshalleseMenomineeMexicanMexican American IndianMongolianMoroccanNative HawaiianNavajoNepaleseNew ZealanderNicaraguanNigerianNorthern EuropeanNorwegianOkinawanOsageOttawaPaiutePakistaniPalestinianPanamanianParaguayanPennsylvania GermanPeruvianPimaPolishPortuguesePotawatomiPuebloPuerto RicanPuget Sound SalishRomanianRussianSalvadoranSamoanScandinavianScotch-IrishScottishSeminoleSenegaleseSerbianShoshoneSierra LeoneanSiouxSlavicSlovakSloveneSomaliSouth AfricanSouth AmericanSouth American IndianSoviet UnionSpaniardSpanishSpanish AmericanSpanish American IndianSri LankanSubsaharan AfricanSudaneseSwedishSwissSyrianTaiwaneseThaiTlingit-HaidaTohono O'OdhamTonganTrinidadian and TobagonianTsimshianTurkishU.S. Virgin IslanderUgandanUkrainianUruguayanUteVenezuelanVietnameseWelshWest IndianYakamaYaquiYugoslavianYumanYup'ikZimbabwean
Immigration
NonimmigrantsImmigrantsAfghanistanAfricaAlbaniaArgentinaArmeniaAsiaAustraliaAustriaBahamasBangladeshBarbadosBelarusBelgiumBelizeBoliviaBosnia and HerzegovinaBrazilBulgariaBurma/MyanmarCabo VerdeCambodiaCameroonCanadaCaribbeanCentral AmericaChileChinaColombiaCongoCosta RicaCroatiaCubaCzechoslovakiaDenmarkDominicaDominican RepublicEastern AfricaEastern AsiaEastern EuropeEcuadorEgyptEl SalvadorEnglandEritreaEthiopiaEuropeFijiFranceGermanyGhanaGreeceGrenadaGuatemalaGuyanaHaitiHondurasHong KongHungaryIndiaIndonesiaIranIraqIrelandIsraelItalyJamaicaJapanJordanKazakhstanKenyaKoreaKuwaitLaosLatin AmericaLatviaLebanonLiberiaLithuaniaMalaysiaMexicoMicronesiaMiddle AfricaMoldovaMoroccoNepalNetherlandsNicaraguaNigeriaNorth AmericaNorth MacedoniaNorthern AfricaNorthern EuropeNorwayOceaniaPakistanPanamaPeruPhilippinesPolandPortugalRomaniaRussiaSaudi ArabiaScotlandSenegalSerbiaSierra LeoneSingaporeSomaliaSouth AfricaSouth Central AsiaSouth Eastern AsiaSouthern EuropeSpainSri LankaSt. Vincent and the GrenadinesSudanSwedenSwitzerlandSyriaTaiwanThailandTrinidad and TobagoTurkeyUgandaUkraineUruguayUzbekistanVenezuelaVietnamWest IndiesWestern AfricaWestern AsiaWestern EuropeYemenZaireZimbabweAzores
Immigrants from South America
Race
Ancestry
AfghanAfricanAlaska NativeAlaskan AthabascanAlbanianAleutAlsatianAmericanApacheArabArapahoArgentineanArmenianAssyrian/Chaldean/SyriacAustralianAustrianBahamianBangladeshiBarbadianBasqueBelgianBelizeanBermudanBhutaneseBlackfeetBolivianBrazilianBritishBritish West IndianBulgarianBurmeseCajunCambodianCanadianCape VerdeanCarpatho RusynCelticCentral AmericanCentral American IndianCherokeeCheyenneChickasawChileanChineseChippewaChoctawColombianColvilleComancheCosta RicanCreeCreekCroatianCrowCubanCypriotCzechCzechoslovakianDanishDominicanDutchDutch West IndianEastern EuropeanEcuadorianEgyptianEnglishEstonianEthiopianEuropeanFijianFilipinoFinnishFrenchFrench American IndianFrench CanadianGermanGerman RussianGhanaianGreekGuamanian/ChamorroGuatemalanGuyaneseHaitianHmongHonduranHopiHoumaHungarianIcelanderIndian (Asian)IndonesianInupiatIranianIraqiIrishIroquoisIsraeliItalianJamaicanJapaneseJordanianKenyanKiowaKoreanLaotianLatvianLebaneseLiberianLithuanianLumbeeLuxembourgerMacedonianMalaysianMalteseMarshalleseMenomineeMexicanMexican American IndianMongolianMoroccanNative HawaiianNavajoNepaleseNew ZealanderNicaraguanNigerianNorthern EuropeanNorwegianOkinawanOsageOttawaPaiutePakistaniPalestinianPanamanianParaguayanPennsylvania GermanPeruvianPimaPolishPortuguesePotawatomiPuebloPuerto RicanPuget Sound SalishRomanianRussianSalvadoranSamoanScandinavianScotch-IrishScottishSeminoleSenegaleseSerbianShoshoneSierra LeoneanSiouxSlavicSlovakSloveneSomaliSouth AfricanSouth AmericanSouth American IndianSoviet UnionSpaniardSpanishSpanish AmericanSpanish American IndianSri LankanSubsaharan AfricanSudaneseSwedishSwissSyrianTaiwaneseThaiTlingit-HaidaTohono O'OdhamTonganTrinidadian and TobagonianTsimshianTurkishU.S. Virgin IslanderUgandanUkrainianUruguayanUteVenezuelanVietnameseWelshWest IndianYakamaYaquiYugoslavianYumanYup'ikZimbabwean
Immigration
NonimmigrantsImmigrantsAfghanistanAfricaAlbaniaArgentinaArmeniaAsiaAustraliaAustriaBahamasBangladeshBarbadosBelarusBelgiumBelizeBoliviaBosnia and HerzegovinaBrazilBulgariaBurma/MyanmarCabo VerdeCambodiaCameroonCanadaCaribbeanCentral AmericaChileChinaColombiaCongoCosta RicaCroatiaCubaCzechoslovakiaDenmarkDominicaDominican RepublicEastern AfricaEastern AsiaEastern EuropeEcuadorEgyptEl SalvadorEnglandEritreaEthiopiaEuropeFijiFranceGermanyGhanaGreeceGrenadaGuatemalaGuyanaHaitiHondurasHong KongHungaryIndiaIndonesiaIranIraqIrelandIsraelItalyJamaicaJapanJordanKazakhstanKenyaKoreaKuwaitLaosLatin AmericaLatviaLebanonLiberiaLithuaniaMalaysiaMexicoMicronesiaMiddle AfricaMoldovaMoroccoNepalNetherlandsNicaraguaNigeriaNorth AmericaNorth MacedoniaNorthern AfricaNorthern EuropeNorwayOceaniaPakistanPanamaPeruPhilippinesPolandPortugalRomaniaRussiaSaudi ArabiaScotlandSenegalSerbiaSierra LeoneSingaporeSomaliaSouth AfricaSouth AmericaSouth Central AsiaSouth Eastern AsiaSouthern EuropeSpainSri LankaSt. Vincent and the GrenadinesSudanSwedenSwitzerlandSyriaTaiwanThailandTrinidad and TobagoTurkeyUgandaUkraineUruguayUzbekistanVenezuelaVietnamWest IndiesWestern AfricaWestern AsiaWestern EuropeYemenZaireZimbabweAzores
In Labor Force | Age 20-24
Income
Poverty
Unemployment
Labor Participation
Family Structure
Vehicle Availability
Education Level
Disability

In Labor Force | Age 20-24 Comparison

Delaware

Immigrants from South America

Excellent
Tragic
75.5%
IN LABOR FORCE | AGE 20-24
84.5/ 100
METRIC RATING
140th/ 347
METRIC RANK
73.3%
IN LABOR FORCE | AGE 20-24
0.2/ 100
METRIC RATING
275th/ 347
METRIC RANK

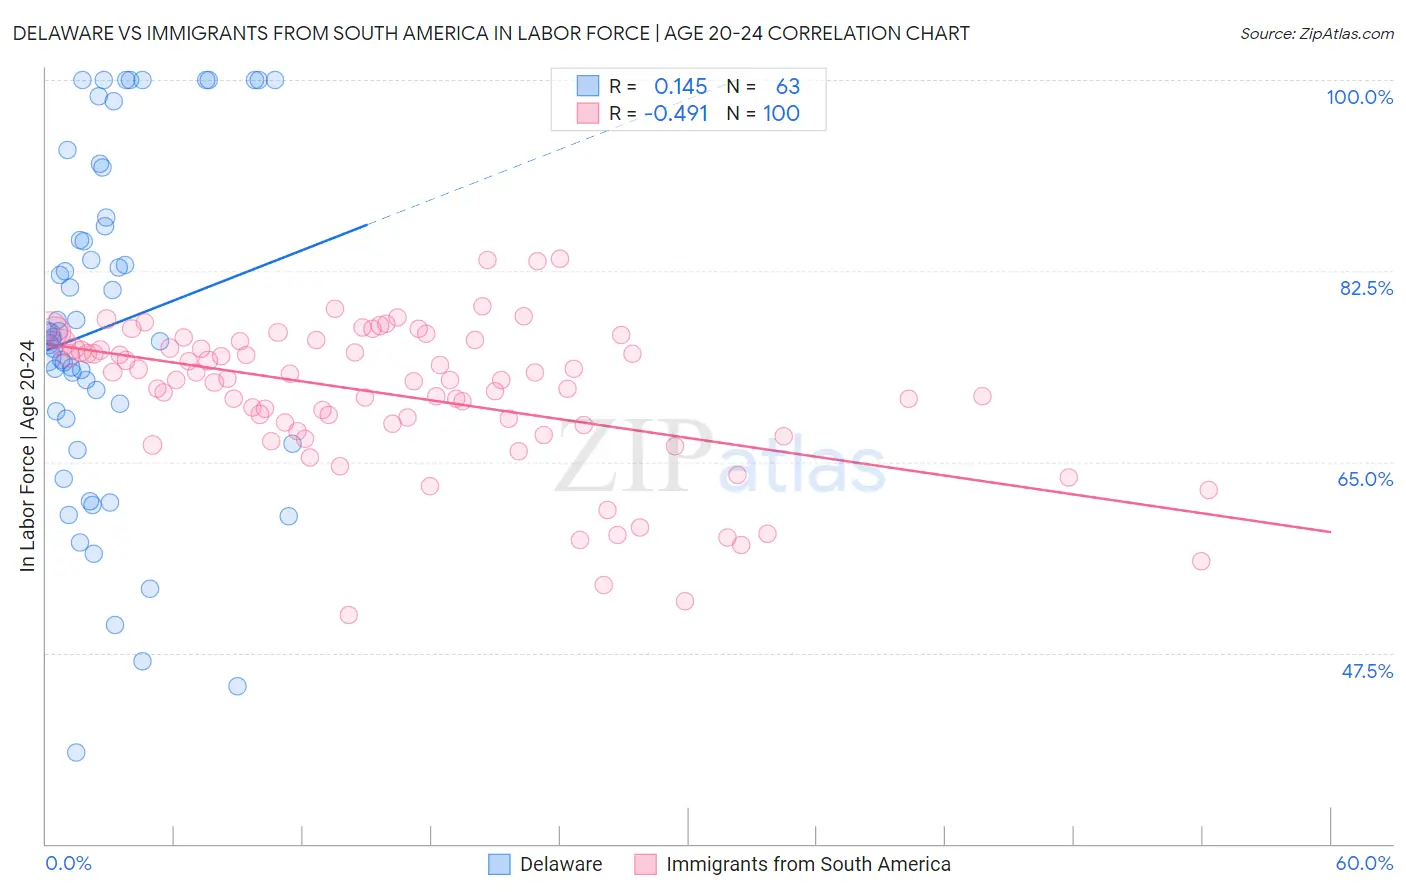
Delaware vs Immigrants from South America In Labor Force | Age 20-24 Correlation Chart

The statistical analysis conducted on geographies consisting of 96,225,060 people shows a poor positive correlation between the proportion of Delaware and labor force participation rate among population between the ages 20 and 24 in the United States with a correlation coefficient (R) of 0.145 and weighted average of 75.5%. Similarly, the statistical analysis conducted on geographies consisting of 486,128,145 people shows a moderate negative correlation between the proportion of Immigrants from South America and labor force participation rate among population between the ages 20 and 24 in the United States with a correlation coefficient (R) of -0.491 and weighted average of 73.3%, a difference of 3.0%.
Delaware vs Immigrants from South America In Labor Force | Age 20-24

In Labor Force | Age 20-24 Correlation Summary

MeasurementDelawareImmigrants from South America
Minimum38.4%51.0%
Maximum100.0%83.6%
Range61.6%32.6%
Mean77.4%71.1%
Median76.4%72.5%
Interquartile 25% (IQ1)69.0%68.1%
Interquartile 75% (IQ3)87.4%75.7%
Interquartile Range (IQR)18.4%7.6%
Standard Deviation (Sample)15.6%6.8%
Standard Deviation (Population)15.4%6.7%

Similar Demographics by In Labor Force | Age 20-24

Demographics Similar to Delaware by In Labor Force | Age 20-24

In terms of in labor force | age 20-24, the demographic groups most similar to Delaware are Immigrants from England (75.5%, a difference of 0.0%), Immigrants from Brazil (75.5%, a difference of 0.010%), Jordanian (75.5%, a difference of 0.010%), Australian (75.5%, a difference of 0.010%), and Romanian (75.5%, a difference of 0.010%).
DemographicsRating | RankIn Labor Force | Age 20-24
Zimbabweans
88.2
/100
|
#133
Excellent
75.6%
Estonians
87.1
/100
|
#134
Excellent
75.6%
Yaqui
85.5
/100
|
#135
Excellent
75.5%
Immigrants | Brazil
84.8
/100
|
#136
Excellent
75.5%
Jordanians
84.8
/100
|
#137
Excellent
75.5%
Australians
84.8
/100
|
#138
Excellent
75.5%
Immigrants | England
84.6
/100
|
#139
Excellent
75.5%
Delaware
84.5
/100
|
#140
Excellent
75.5%
Romanians
84.1
/100
|
#141
Excellent
75.5%
Blackfeet
83.6
/100
|
#142
Excellent
75.5%
Spaniards
82.0
/100
|
#143
Excellent
75.5%
Bhutanese
80.8
/100
|
#144
Excellent
75.4%
Koreans
79.7
/100
|
#145
Good
75.4%
Mexican American Indians
78.8
/100
|
#146
Good
75.4%
Comanche
77.6
/100
|
#147
Good
75.4%

Demographics Similar to Immigrants from South America by In Labor Force | Age 20-24

In terms of in labor force | age 20-24, the demographic groups most similar to Immigrants from South America are Mongolian (73.3%, a difference of 0.010%), Immigrants from Malaysia (73.3%, a difference of 0.020%), Cypriot (73.3%, a difference of 0.040%), Immigrants from Colombia (73.4%, a difference of 0.050%), and Venezuelan (73.3%, a difference of 0.050%).
DemographicsRating | RankIn Labor Force | Age 20-24
South Americans
0.4
/100
|
#268
Tragic
73.5%
Colombians
0.3
/100
|
#269
Tragic
73.5%
Immigrants | Russia
0.3
/100
|
#270
Tragic
73.5%
Immigrants | Indonesia
0.3
/100
|
#271
Tragic
73.4%
Belizeans
0.3
/100
|
#272
Tragic
73.4%
Cheyenne
0.2
/100
|
#273
Tragic
73.4%
Immigrants | Colombia
0.2
/100
|
#274
Tragic
73.4%
Immigrants | South America
0.2
/100
|
#275
Tragic
73.3%
Mongolians
0.2
/100
|
#276
Tragic
73.3%
Immigrants | Malaysia
0.2
/100
|
#277
Tragic
73.3%
Cypriots
0.2
/100
|
#278
Tragic
73.3%
Venezuelans
0.2
/100
|
#279
Tragic
73.3%
Bahamians
0.1
/100
|
#280
Tragic
73.3%
Immigrants | Venezuela
0.1
/100
|
#281
Tragic
73.2%
Immigrants | Spain
0.1
/100
|
#282
Tragic
73.2%