Czechoslovakian vs Immigrants from France In Labor Force | Age 16-19

COMPARE

Czechoslovakian
Race
Ancestry
AfghanAfricanAlaska NativeAlaskan AthabascanAlbanianAleutAlsatianAmericanApacheArabArapahoArgentineanArmenianAssyrian/Chaldean/SyriacAustralianAustrianBahamianBangladeshiBarbadianBasqueBelgianBelizeanBermudanBhutaneseBlackfeetBolivianBrazilianBritishBritish West IndianBulgarianBurmeseCajunCambodianCanadianCape VerdeanCarpatho RusynCelticCentral AmericanCentral American IndianCherokeeCheyenneChickasawChileanChineseChippewaChoctawColombianColvilleComancheCosta RicanCreeCreekCroatianCrowCubanCypriotCzechCzechoslovakianDanishDelawareDominicanDutchDutch West IndianEastern EuropeanEcuadorianEgyptianEnglishEstonianEthiopianEuropeanFijianFilipinoFinnishFrenchFrench American IndianFrench CanadianGermanGerman RussianGhanaianGreekGuamanian/ChamorroGuatemalanGuyaneseHaitianHmongHonduranHopiHoumaHungarianIcelanderIndian (Asian)IndonesianInupiatIranianIraqiIrishIroquoisIsraeliItalianJamaicanJapaneseJordanianKenyanKiowaKoreanLaotianLatvianLebaneseLiberianLithuanianLumbeeLuxembourgerMacedonianMalaysianMalteseMarshalleseMenomineeMexicanMexican American IndianMongolianMoroccanNative HawaiianNavajoNepaleseNew ZealanderNicaraguanNigerianNorthern EuropeanNorwegianOkinawanOsageOttawaPaiutePakistaniPalestinianPanamanianParaguayanPennsylvania GermanPeruvianPimaPolishPortuguesePotawatomiPuebloPuerto RicanPuget Sound SalishRomanianRussianSalvadoranSamoanScandinavianScotch-IrishScottishSeminoleSenegaleseSerbianShoshoneSierra LeoneanSiouxSlavicSlovakSloveneSomaliSouth AfricanSouth AmericanSouth American IndianSoviet UnionSpaniardSpanishSpanish AmericanSpanish American IndianSri LankanSubsaharan AfricanSudaneseSwedishSwissSyrianTaiwaneseThaiTlingit-HaidaTohono O'OdhamTonganTrinidadian and TobagonianTsimshianTurkishU.S. Virgin IslanderUgandanUkrainianUruguayanUteVenezuelanVietnameseWelshWest IndianYakamaYaquiYugoslavianYumanYup'ikZimbabwean
Immigration
NonimmigrantsImmigrantsAfghanistanAfricaAlbaniaArgentinaArmeniaAsiaAustraliaAustriaBahamasBangladeshBarbadosBelarusBelgiumBelizeBoliviaBosnia and HerzegovinaBrazilBulgariaBurma/MyanmarCabo VerdeCambodiaCameroonCanadaCaribbeanCentral AmericaChileChinaColombiaCongoCosta RicaCroatiaCubaCzechoslovakiaDenmarkDominicaDominican RepublicEastern AfricaEastern AsiaEastern EuropeEcuadorEgyptEl SalvadorEnglandEritreaEthiopiaEuropeFijiGermanyGhanaGreeceGrenadaGuatemalaGuyanaHaitiHondurasHong KongHungaryIndiaIndonesiaIranIraqIrelandIsraelItalyJamaicaJapanJordanKazakhstanKenyaKoreaKuwaitLaosLatin AmericaLatviaLebanonLiberiaLithuaniaMalaysiaMexicoMicronesiaMiddle AfricaMoldovaMoroccoNepalNetherlandsNicaraguaNigeriaNorth AmericaNorth MacedoniaNorthern AfricaNorthern EuropeNorwayOceaniaPakistanPanamaPeruPhilippinesPolandPortugalRomaniaRussiaSaudi ArabiaScotlandSenegalSerbiaSierra LeoneSingaporeSomaliaSouth AfricaSouth AmericaSouth Central AsiaSouth Eastern AsiaSouthern EuropeSpainSri LankaSt. Vincent and the GrenadinesSudanSwedenSwitzerlandSyriaTaiwanThailandTrinidad and TobagoTurkeyUgandaUkraineUruguayUzbekistanVenezuelaVietnamWest IndiesWestern AfricaWestern AsiaWestern EuropeYemenZaireZimbabweAzores
Immigrants from France
Race
Ancestry
AfghanAfricanAlaska NativeAlaskan AthabascanAlbanianAleutAlsatianAmericanApacheArabArapahoArgentineanArmenianAssyrian/Chaldean/SyriacAustralianAustrianBahamianBangladeshiBarbadianBasqueBelgianBelizeanBermudanBhutaneseBlackfeetBolivianBrazilianBritishBritish West IndianBulgarianBurmeseCajunCambodianCanadianCape VerdeanCarpatho RusynCelticCentral AmericanCentral American IndianCherokeeCheyenneChickasawChileanChineseChippewaChoctawColombianColvilleComancheCosta RicanCreeCreekCroatianCrowCubanCypriotCzechDanishDelawareDominicanDutchDutch West IndianEastern EuropeanEcuadorianEgyptianEnglishEstonianEthiopianEuropeanFijianFilipinoFinnishFrenchFrench American IndianFrench CanadianGermanGerman RussianGhanaianGreekGuamanian/ChamorroGuatemalanGuyaneseHaitianHmongHonduranHopiHoumaHungarianIcelanderIndian (Asian)IndonesianInupiatIranianIraqiIrishIroquoisIsraeliItalianJamaicanJapaneseJordanianKenyanKiowaKoreanLaotianLatvianLebaneseLiberianLithuanianLumbeeLuxembourgerMacedonianMalaysianMalteseMarshalleseMenomineeMexicanMexican American IndianMongolianMoroccanNative HawaiianNavajoNepaleseNew ZealanderNicaraguanNigerianNorthern EuropeanNorwegianOkinawanOsageOttawaPaiutePakistaniPalestinianPanamanianParaguayanPennsylvania GermanPeruvianPimaPolishPortuguesePotawatomiPuebloPuerto RicanPuget Sound SalishRomanianRussianSalvadoranSamoanScandinavianScotch-IrishScottishSeminoleSenegaleseSerbianShoshoneSierra LeoneanSiouxSlavicSlovakSloveneSomaliSouth AfricanSouth AmericanSouth American IndianSoviet UnionSpaniardSpanishSpanish AmericanSpanish American IndianSri LankanSubsaharan AfricanSudaneseSwedishSwissSyrianTaiwaneseThaiTlingit-HaidaTohono O'OdhamTonganTrinidadian and TobagonianTsimshianTurkishU.S. Virgin IslanderUgandanUkrainianUruguayanUteVenezuelanVietnameseWelshWest IndianYakamaYaquiYugoslavianYumanYup'ikZimbabwean
Immigration
NonimmigrantsImmigrantsAfghanistanAfricaAlbaniaArgentinaArmeniaAsiaAustraliaAustriaBahamasBangladeshBarbadosBelarusBelgiumBelizeBoliviaBosnia and HerzegovinaBrazilBulgariaBurma/MyanmarCabo VerdeCambodiaCameroonCanadaCaribbeanCentral AmericaChileChinaColombiaCongoCosta RicaCroatiaCubaCzechoslovakiaDenmarkDominicaDominican RepublicEastern AfricaEastern AsiaEastern EuropeEcuadorEgyptEl SalvadorEnglandEritreaEthiopiaEuropeFijiFranceGermanyGhanaGreeceGrenadaGuatemalaGuyanaHaitiHondurasHong KongHungaryIndiaIndonesiaIranIraqIrelandIsraelItalyJamaicaJapanJordanKazakhstanKenyaKoreaKuwaitLaosLatin AmericaLatviaLebanonLiberiaLithuaniaMalaysiaMexicoMicronesiaMiddle AfricaMoldovaMoroccoNepalNetherlandsNicaraguaNigeriaNorth AmericaNorth MacedoniaNorthern AfricaNorthern EuropeNorwayOceaniaPakistanPanamaPeruPhilippinesPolandPortugalRomaniaRussiaSaudi ArabiaScotlandSenegalSerbiaSierra LeoneSingaporeSomaliaSouth AfricaSouth AmericaSouth Central AsiaSouth Eastern AsiaSouthern EuropeSpainSri LankaSt. Vincent and the GrenadinesSudanSwedenSwitzerlandSyriaTaiwanThailandTrinidad and TobagoTurkeyUgandaUkraineUruguayUzbekistanVenezuelaVietnamWest IndiesWestern AfricaWestern AsiaWestern EuropeYemenZaireZimbabweAzores
In Labor Force | Age 16-19
Income
Poverty
Unemployment
Labor Participation
Family Structure
Vehicle Availability
Education Level
Disability

In Labor Force | Age 16-19 Comparison

Czechoslovakians

Immigrants from France

Exceptional
Tragic
41.9%
IN LABOR FORCE | AGE 16-19
100.0/ 100
METRIC RATING
32nd/ 347
METRIC RANK
35.1%
IN LABOR FORCE | AGE 16-19
4.3/ 100
METRIC RATING
233rd/ 347
METRIC RANK

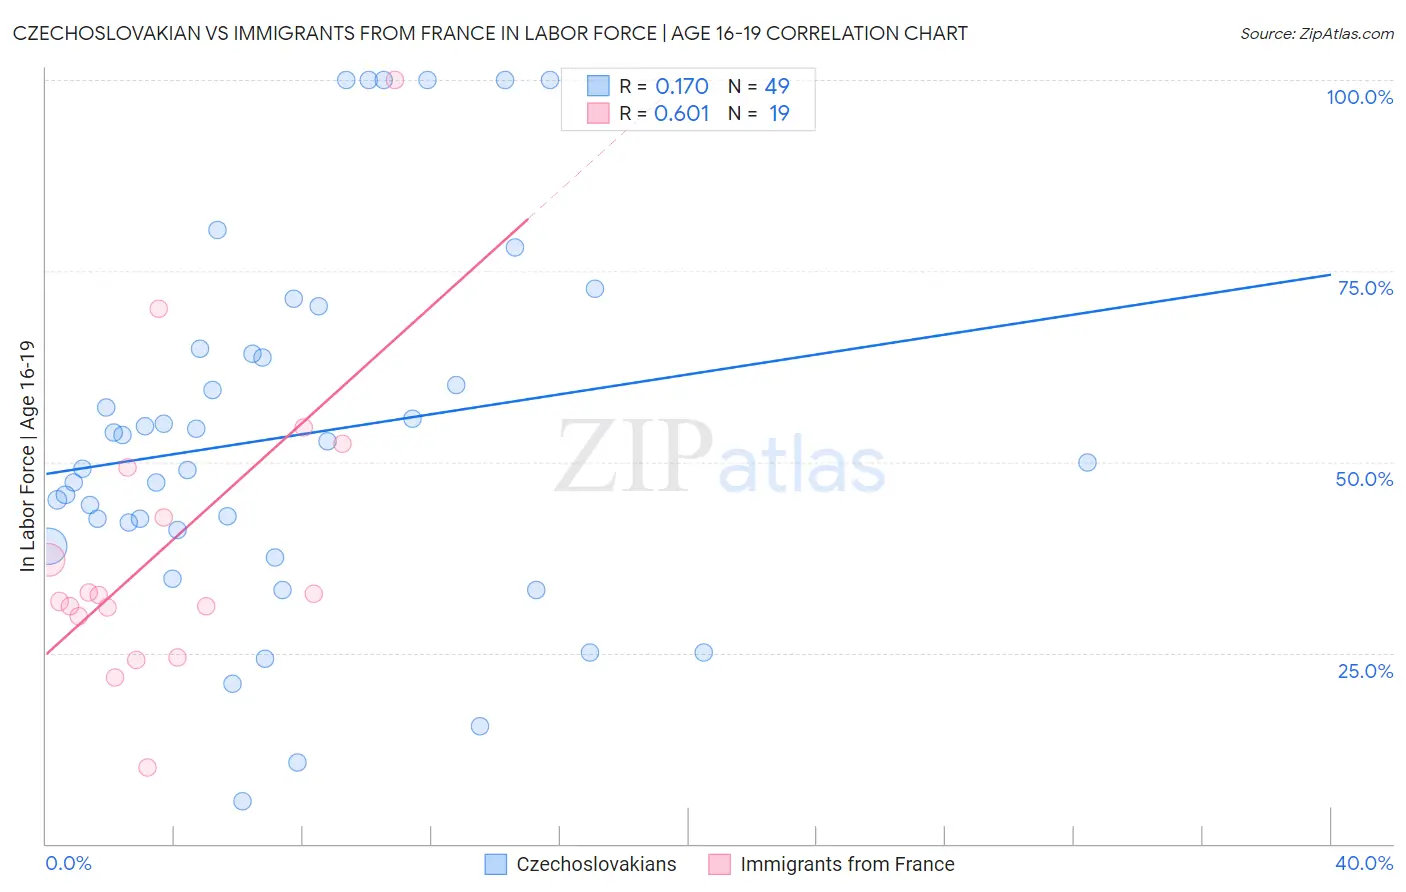
Czechoslovakian vs Immigrants from France In Labor Force | Age 16-19 Correlation Chart

The statistical analysis conducted on geographies consisting of 368,118,487 people shows a poor positive correlation between the proportion of Czechoslovakians and labor force participation rate among population between the ages 16 and 19 in the United States with a correlation coefficient (R) of 0.170 and weighted average of 41.9%. Similarly, the statistical analysis conducted on geographies consisting of 287,415,208 people shows a significant positive correlation between the proportion of Immigrants from France and labor force participation rate among population between the ages 16 and 19 in the United States with a correlation coefficient (R) of 0.601 and weighted average of 35.1%, a difference of 19.2%.
Czechoslovakian vs Immigrants from France In Labor Force | Age 16-19

In Labor Force | Age 16-19 Correlation Summary

MeasurementCzechoslovakianImmigrants from France
Minimum5.6%9.9%
Maximum100.0%100.0%
Range94.4%90.1%
Mean53.4%38.9%
Median50.0%32.5%
Interquartile 25% (IQ1)40.0%29.8%
Interquartile 75% (IQ3)64.5%49.3%
Interquartile Range (IQR)24.5%19.5%
Standard Deviation (Sample)23.9%20.1%
Standard Deviation (Population)23.7%19.5%

Similar Demographics by In Labor Force | Age 16-19

Demographics Similar to Czechoslovakians by In Labor Force | Age 16-19

In terms of in labor force | age 16-19, the demographic groups most similar to Czechoslovakians are Liberian (41.8%, a difference of 0.14%), Irish (42.0%, a difference of 0.20%), Immigrants from Bosnia and Herzegovina (41.8%, a difference of 0.22%), Yugoslavian (41.8%, a difference of 0.24%), and Scottish (42.0%, a difference of 0.27%).
DemographicsRating | RankIn Labor Force | Age 16-19
German Russians
100.0
/100
|
#25
Exceptional
42.4%
English
100.0
/100
|
#26
Exceptional
42.4%
Welsh
100.0
/100
|
#27
Exceptional
42.3%
Poles
100.0
/100
|
#28
Exceptional
42.1%
French
100.0
/100
|
#29
Exceptional
42.1%
Scottish
100.0
/100
|
#30
Exceptional
42.0%
Irish
100.0
/100
|
#31
Exceptional
42.0%
Czechoslovakians
100.0
/100
|
#32
Exceptional
41.9%
Liberians
100.0
/100
|
#33
Exceptional
41.8%
Immigrants | Bosnia and Herzegovina
100.0
/100
|
#34
Exceptional
41.8%
Yugoslavians
100.0
/100
|
#35
Exceptional
41.8%
Immigrants | Azores
100.0
/100
|
#36
Exceptional
41.7%
Immigrants | Congo
100.0
/100
|
#37
Exceptional
41.7%
Sioux
100.0
/100
|
#38
Exceptional
41.5%
Scotch-Irish
100.0
/100
|
#39
Exceptional
41.5%

Demographics Similar to Immigrants from France by In Labor Force | Age 16-19

In terms of in labor force | age 16-19, the demographic groups most similar to Immigrants from France are Immigrants from Syria (35.2%, a difference of 0.040%), Immigrants from Kazakhstan (35.2%, a difference of 0.040%), Immigrants from Mexico (35.1%, a difference of 0.040%), Immigrants from Philippines (35.1%, a difference of 0.12%), and Immigrants from Honduras (35.2%, a difference of 0.17%).
DemographicsRating | RankIn Labor Force | Age 16-19
Immigrants | Guatemala
5.7
/100
|
#226
Tragic
35.3%
Mongolians
5.7
/100
|
#227
Tragic
35.3%
Immigrants | Senegal
5.5
/100
|
#228
Tragic
35.3%
Immigrants | Lebanon
5.0
/100
|
#229
Tragic
35.2%
Immigrants | Honduras
4.9
/100
|
#230
Tragic
35.2%
Immigrants | Syria
4.5
/100
|
#231
Tragic
35.2%
Immigrants | Kazakhstan
4.5
/100
|
#232
Tragic
35.2%
Immigrants | France
4.3
/100
|
#233
Tragic
35.1%
Immigrants | Mexico
4.2
/100
|
#234
Tragic
35.1%
Immigrants | Philippines
4.0
/100
|
#235
Tragic
35.1%
Immigrants | Australia
3.6
/100
|
#236
Tragic
35.1%
Immigrants | India
3.5
/100
|
#237
Tragic
35.0%
Immigrants | Vietnam
3.4
/100
|
#238
Tragic
35.0%
Inupiat
3.2
/100
|
#239
Tragic
35.0%
Immigrants | Central America
3.0
/100
|
#240
Tragic
35.0%