Czechoslovakian vs Immigrants from Bosnia and Herzegovina In Labor Force | Age 20-64
COMPARE
Czechoslovakian
Immigrants from Bosnia and Herzegovina
In Labor Force | Age 20-64
In Labor Force | Age 20-64 Comparison
Czechoslovakians
Immigrants from Bosnia and Herzegovina
79.5%
IN LABOR FORCE | AGE 20-64
44.3/ 100
METRIC RATING
178th/ 347
METRIC RANK
80.8%
IN LABOR FORCE | AGE 20-64
100.0/ 100
METRIC RATING
23rd/ 347
METRIC RANK
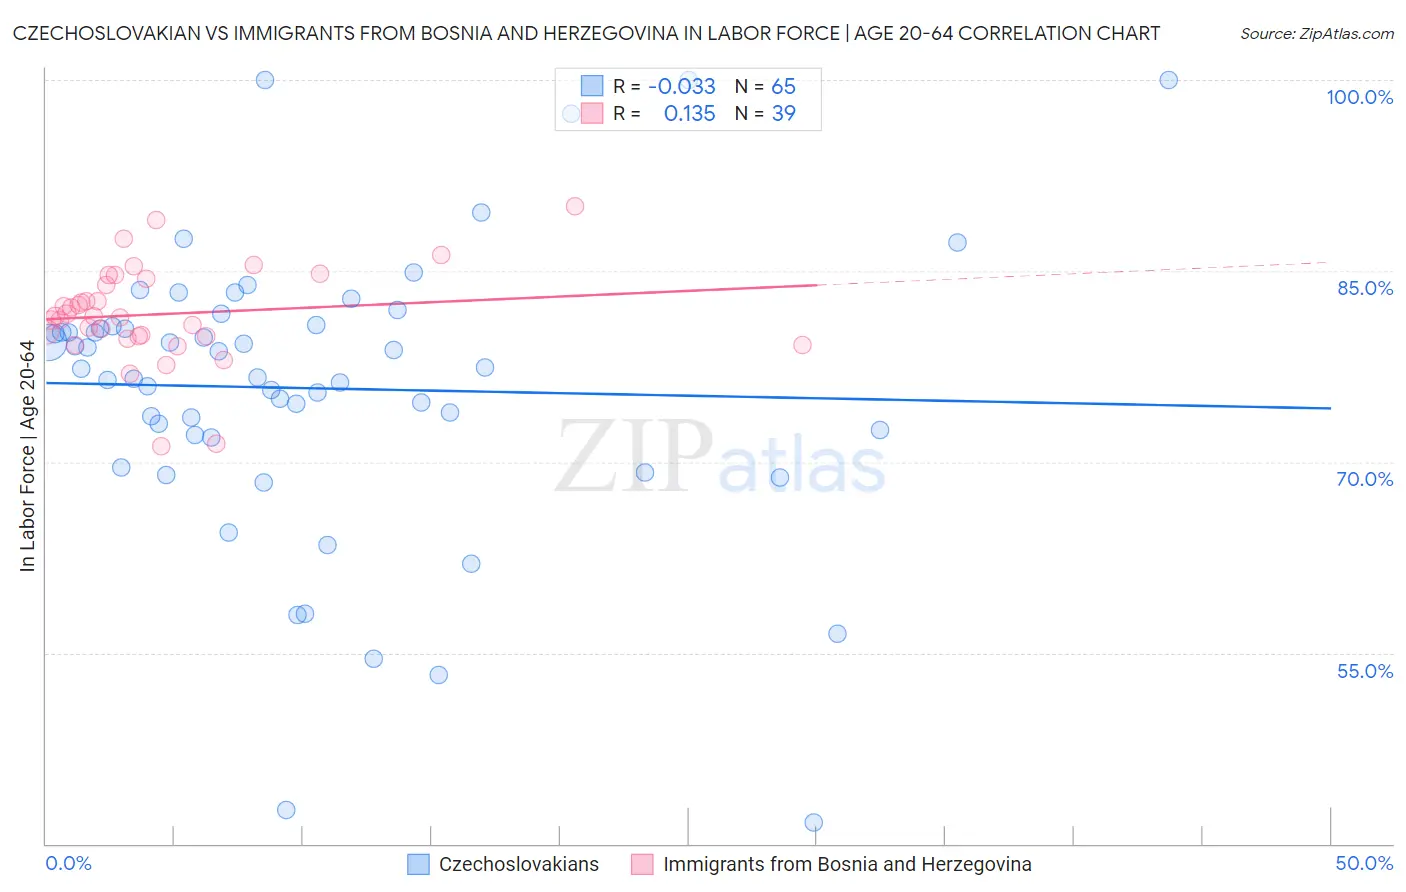
Czechoslovakian vs Immigrants from Bosnia and Herzegovina In Labor Force | Age 20-64 Correlation Chart
The statistical analysis conducted on geographies consisting of 368,672,704 people shows no correlation between the proportion of Czechoslovakians and labor force participation rate among population between the ages 20 and 64 in the United States with a correlation coefficient (R) of -0.033 and weighted average of 79.5%. Similarly, the statistical analysis conducted on geographies consisting of 156,819,568 people shows a poor positive correlation between the proportion of Immigrants from Bosnia and Herzegovina and labor force participation rate among population between the ages 20 and 64 in the United States with a correlation coefficient (R) of 0.135 and weighted average of 80.8%, a difference of 1.7%.
In Labor Force | Age 20-64 Correlation Summary
| Measurement | Czechoslovakian | Immigrants from Bosnia and Herzegovina |
| Minimum | 41.7% | 71.2% |
| Maximum | 100.0% | 90.1% |
| Range | 58.3% | 18.9% |
| Mean | 75.8% | 81.6% |
| Median | 77.3% | 81.4% |
| Interquartile 25% (IQ1) | 72.0% | 79.8% |
| Interquartile 75% (IQ3) | 80.7% | 84.4% |
| Interquartile Range (IQR) | 8.7% | 4.5% |
| Standard Deviation (Sample) | 11.4% | 3.8% |
| Standard Deviation (Population) | 11.3% | 3.8% |
Similar Demographics by In Labor Force | Age 20-64
Demographics Similar to Czechoslovakians by In Labor Force | Age 20-64
In terms of in labor force | age 20-64, the demographic groups most similar to Czechoslovakians are Cuban (79.5%, a difference of 0.010%), Australian (79.5%, a difference of 0.010%), Immigrants from Netherlands (79.5%, a difference of 0.010%), Armenian (79.5%, a difference of 0.020%), and Salvadoran (79.5%, a difference of 0.030%).
| Demographics | Rating | Rank | In Labor Force | Age 20-64 |
| Immigrants | Switzerland | 53.3 /100 | #171 | Average 79.6% |
| Immigrants | Belgium | 53.1 /100 | #172 | Average 79.6% |
| Immigrants | Scotland | 52.4 /100 | #173 | Average 79.6% |
| Syrians | 50.0 /100 | #174 | Average 79.6% |
| Cubans | 46.1 /100 | #175 | Average 79.5% |
| Australians | 46.0 /100 | #176 | Average 79.5% |
| Immigrants | Netherlands | 45.2 /100 | #177 | Average 79.5% |
| Czechoslovakians | 44.3 /100 | #178 | Average 79.5% |
| Armenians | 41.4 /100 | #179 | Average 79.5% |
| Salvadorans | 41.0 /100 | #180 | Average 79.5% |
| Immigrants | Saudi Arabia | 37.7 /100 | #181 | Fair 79.5% |
| Malaysians | 37.1 /100 | #182 | Fair 79.5% |
| Immigrants | Hungary | 36.8 /100 | #183 | Fair 79.5% |
| Finns | 35.9 /100 | #184 | Fair 79.5% |
| Israelis | 34.7 /100 | #185 | Fair 79.5% |
Demographics Similar to Immigrants from Bosnia and Herzegovina by In Labor Force | Age 20-64
In terms of in labor force | age 20-64, the demographic groups most similar to Immigrants from Bosnia and Herzegovina are Sudanese (80.8%, a difference of 0.0%), Immigrants from Morocco (80.8%, a difference of 0.010%), Kenyan (80.8%, a difference of 0.020%), Immigrants from Serbia (80.8%, a difference of 0.040%), and Liberian (80.9%, a difference of 0.080%).
| Demographics | Rating | Rank | In Labor Force | Age 20-64 |
| Immigrants | Nepal | 100.0 /100 | #16 | Exceptional 81.1% |
| Norwegians | 100.0 /100 | #17 | Exceptional 81.0% |
| Immigrants | Bulgaria | 100.0 /100 | #18 | Exceptional 81.0% |
| Zimbabweans | 100.0 /100 | #19 | Exceptional 81.0% |
| Thais | 100.0 /100 | #20 | Exceptional 80.9% |
| Liberians | 100.0 /100 | #21 | Exceptional 80.9% |
| Sudanese | 100.0 /100 | #22 | Exceptional 80.8% |
| Immigrants | Bosnia and Herzegovina | 100.0 /100 | #23 | Exceptional 80.8% |
| Immigrants | Morocco | 100.0 /100 | #24 | Exceptional 80.8% |
| Kenyans | 100.0 /100 | #25 | Exceptional 80.8% |
| Immigrants | Serbia | 100.0 /100 | #26 | Exceptional 80.8% |
| Immigrants | Kenya | 99.9 /100 | #27 | Exceptional 80.7% |
| Immigrants | Uganda | 99.9 /100 | #28 | Exceptional 80.7% |
| Immigrants | South Central Asia | 99.9 /100 | #29 | Exceptional 80.7% |
| Immigrants | North Macedonia | 99.9 /100 | #30 | Exceptional 80.7% |