Cree vs Immigrants from Barbados In Labor Force | Age 35-44
COMPARE
Cree
Immigrants from Barbados
In Labor Force | Age 35-44
In Labor Force | Age 35-44 Comparison
Cree
Immigrants from Barbados
82.0%
IN LABOR FORCE | AGE 35-44
0.0/ 100
METRIC RATING
309th/ 347
METRIC RANK
84.1%
IN LABOR FORCE | AGE 35-44
13.2/ 100
METRIC RATING
214th/ 347
METRIC RANK
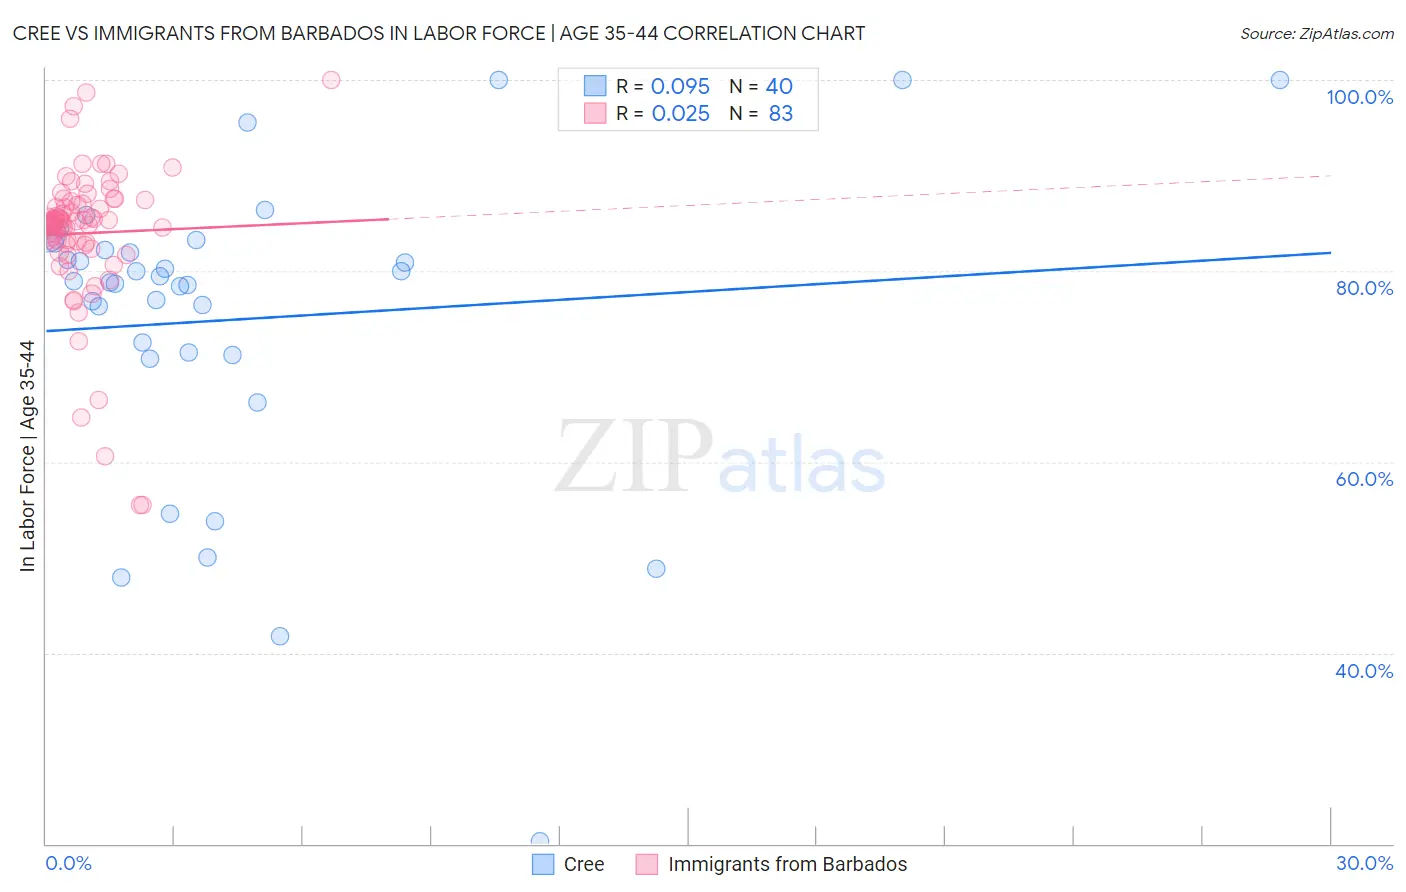
Cree vs Immigrants from Barbados In Labor Force | Age 35-44 Correlation Chart
The statistical analysis conducted on geographies consisting of 76,208,186 people shows a slight positive correlation between the proportion of Cree and labor force participation rate among population between the ages 35 and 44 in the United States with a correlation coefficient (R) of 0.095 and weighted average of 82.0%. Similarly, the statistical analysis conducted on geographies consisting of 112,764,413 people shows no correlation between the proportion of Immigrants from Barbados and labor force participation rate among population between the ages 35 and 44 in the United States with a correlation coefficient (R) of 0.025 and weighted average of 84.1%, a difference of 2.6%.
In Labor Force | Age 35-44 Correlation Summary
| Measurement | Cree | Immigrants from Barbados |
| Minimum | 20.3% | 55.5% |
| Maximum | 100.0% | 100.0% |
| Range | 79.7% | 44.5% |
| Mean | 74.9% | 84.0% |
| Median | 78.9% | 85.1% |
| Interquartile 25% (IQ1) | 71.3% | 82.8% |
| Interquartile 75% (IQ3) | 82.6% | 87.3% |
| Interquartile Range (IQR) | 11.3% | 4.5% |
| Standard Deviation (Sample) | 16.3% | 7.5% |
| Standard Deviation (Population) | 16.1% | 7.5% |
Similar Demographics by In Labor Force | Age 35-44
Demographics Similar to Cree by In Labor Force | Age 35-44
In terms of in labor force | age 35-44, the demographic groups most similar to Cree are Immigrants from Central America (82.0%, a difference of 0.0%), Blackfeet (81.9%, a difference of 0.12%), Hispanic or Latino (82.1%, a difference of 0.15%), Black/African American (82.2%, a difference of 0.25%), and Shoshone (82.2%, a difference of 0.27%).
| Demographics | Rating | Rank | In Labor Force | Age 35-44 |
| Americans | 0.0 /100 | #302 | Tragic 82.4% |
| Nepalese | 0.0 /100 | #303 | Tragic 82.4% |
| Marshallese | 0.0 /100 | #304 | Tragic 82.4% |
| Shoshone | 0.0 /100 | #305 | Tragic 82.2% |
| Blacks/African Americans | 0.0 /100 | #306 | Tragic 82.2% |
| Hispanics or Latinos | 0.0 /100 | #307 | Tragic 82.1% |
| Immigrants | Central America | 0.0 /100 | #308 | Tragic 82.0% |
| Cree | 0.0 /100 | #309 | Tragic 82.0% |
| Blackfeet | 0.0 /100 | #310 | Tragic 81.9% |
| Colville | 0.0 /100 | #311 | Tragic 81.7% |
| Alaska Natives | 0.0 /100 | #312 | Tragic 81.6% |
| Mexicans | 0.0 /100 | #313 | Tragic 81.6% |
| Cajuns | 0.0 /100 | #314 | Tragic 81.5% |
| Immigrants | Mexico | 0.0 /100 | #315 | Tragic 81.5% |
| Comanche | 0.0 /100 | #316 | Tragic 81.5% |
Demographics Similar to Immigrants from Barbados by In Labor Force | Age 35-44
In terms of in labor force | age 35-44, the demographic groups most similar to Immigrants from Barbados are Israeli (84.1%, a difference of 0.010%), Bangladeshi (84.1%, a difference of 0.010%), European (84.1%, a difference of 0.010%), Nicaraguan (84.1%, a difference of 0.020%), and Immigrants from Norway (84.1%, a difference of 0.020%).
| Demographics | Rating | Rank | In Labor Force | Age 35-44 |
| Laotians | 19.0 /100 | #207 | Poor 84.2% |
| Immigrants | North America | 18.1 /100 | #208 | Poor 84.2% |
| Swiss | 17.4 /100 | #209 | Poor 84.2% |
| New Zealanders | 16.2 /100 | #210 | Poor 84.1% |
| Immigrants | Ecuador | 15.2 /100 | #211 | Poor 84.1% |
| Israelis | 14.0 /100 | #212 | Poor 84.1% |
| Bangladeshis | 13.7 /100 | #213 | Poor 84.1% |
| Immigrants | Barbados | 13.2 /100 | #214 | Poor 84.1% |
| Europeans | 12.2 /100 | #215 | Poor 84.1% |
| Nicaraguans | 12.1 /100 | #216 | Poor 84.1% |
| Immigrants | Norway | 11.7 /100 | #217 | Poor 84.1% |
| Immigrants | Nicaragua | 9.4 /100 | #218 | Tragic 84.1% |
| Sub-Saharan Africans | 9.3 /100 | #219 | Tragic 84.1% |
| French | 7.5 /100 | #220 | Tragic 84.0% |
| Icelanders | 6.7 /100 | #221 | Tragic 84.0% |