Cheyenne vs Moroccan In Labor Force | Age 20-24
COMPARE
Cheyenne
Moroccan
In Labor Force | Age 20-24
In Labor Force | Age 20-24 Comparison
Cheyenne
Moroccans
73.4%
IN LABOR FORCE | AGE 20-24
0.2/ 100
METRIC RATING
273rd/ 347
METRIC RANK
74.7%
IN LABOR FORCE | AGE 20-24
20.4/ 100
METRIC RATING
202nd/ 347
METRIC RANK
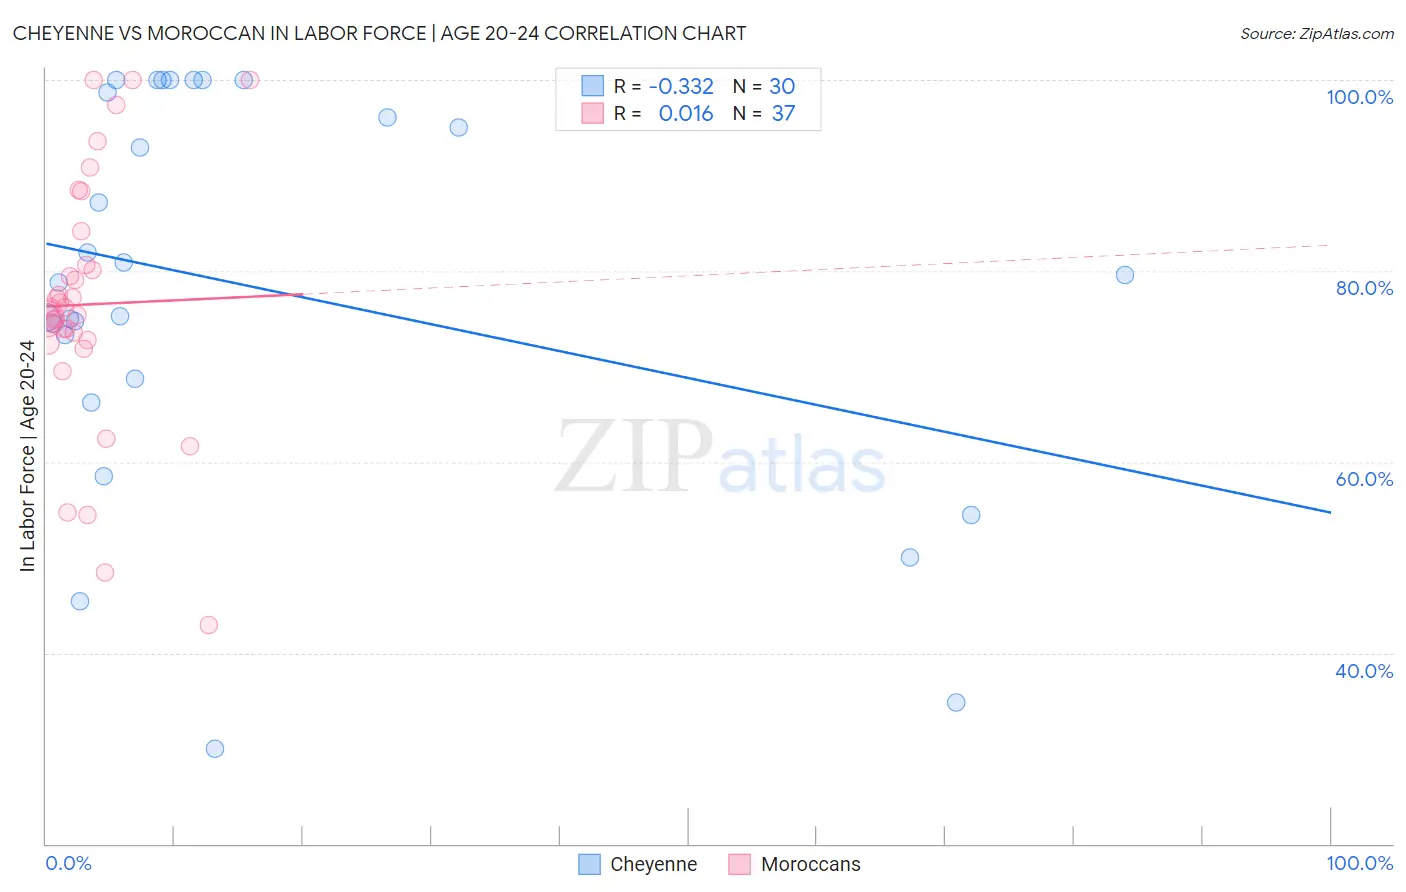
Cheyenne vs Moroccan In Labor Force | Age 20-24 Correlation Chart
The statistical analysis conducted on geographies consisting of 80,658,593 people shows a mild negative correlation between the proportion of Cheyenne and labor force participation rate among population between the ages 20 and 24 in the United States with a correlation coefficient (R) of -0.332 and weighted average of 73.4%. Similarly, the statistical analysis conducted on geographies consisting of 201,764,515 people shows no correlation between the proportion of Moroccans and labor force participation rate among population between the ages 20 and 24 in the United States with a correlation coefficient (R) of 0.016 and weighted average of 74.7%, a difference of 1.7%.
In Labor Force | Age 20-24 Correlation Summary
| Measurement | Cheyenne | Moroccan |
| Minimum | 30.0% | 42.9% |
| Maximum | 100.0% | 100.0% |
| Range | 70.0% | 57.1% |
| Mean | 78.2% | 76.5% |
| Median | 79.2% | 76.1% |
| Interquartile 25% (IQ1) | 68.6% | 72.6% |
| Interquartile 75% (IQ3) | 98.7% | 82.4% |
| Interquartile Range (IQR) | 30.1% | 9.8% |
| Standard Deviation (Sample) | 20.4% | 13.3% |
| Standard Deviation (Population) | 20.0% | 13.2% |
Similar Demographics by In Labor Force | Age 20-24
Demographics Similar to Cheyenne by In Labor Force | Age 20-24
In terms of in labor force | age 20-24, the demographic groups most similar to Cheyenne are Immigrants from Colombia (73.4%, a difference of 0.020%), Belizean (73.4%, a difference of 0.030%), Immigrants from Indonesia (73.4%, a difference of 0.040%), Immigrants from South America (73.3%, a difference of 0.070%), and Mongolian (73.3%, a difference of 0.080%).
| Demographics | Rating | Rank | In Labor Force | Age 20-24 |
| Haitians | 0.5 /100 | #266 | Tragic 73.6% |
| Immigrants | Western Asia | 0.4 /100 | #267 | Tragic 73.5% |
| South Americans | 0.4 /100 | #268 | Tragic 73.5% |
| Colombians | 0.3 /100 | #269 | Tragic 73.5% |
| Immigrants | Russia | 0.3 /100 | #270 | Tragic 73.5% |
| Immigrants | Indonesia | 0.3 /100 | #271 | Tragic 73.4% |
| Belizeans | 0.3 /100 | #272 | Tragic 73.4% |
| Cheyenne | 0.2 /100 | #273 | Tragic 73.4% |
| Immigrants | Colombia | 0.2 /100 | #274 | Tragic 73.4% |
| Immigrants | South America | 0.2 /100 | #275 | Tragic 73.3% |
| Mongolians | 0.2 /100 | #276 | Tragic 73.3% |
| Immigrants | Malaysia | 0.2 /100 | #277 | Tragic 73.3% |
| Cypriots | 0.2 /100 | #278 | Tragic 73.3% |
| Venezuelans | 0.2 /100 | #279 | Tragic 73.3% |
| Bahamians | 0.1 /100 | #280 | Tragic 73.3% |
Demographics Similar to Moroccans by In Labor Force | Age 20-24
In terms of in labor force | age 20-24, the demographic groups most similar to Moroccans are Choctaw (74.7%, a difference of 0.020%), Nigerian (74.7%, a difference of 0.030%), Taiwanese (74.7%, a difference of 0.060%), Immigrants from Northern Africa (74.6%, a difference of 0.060%), and Immigrants from Italy (74.6%, a difference of 0.070%).
| Demographics | Rating | Rank | In Labor Force | Age 20-24 |
| Eastern Europeans | 25.4 /100 | #195 | Fair 74.8% |
| Immigrants | Vietnam | 25.1 /100 | #196 | Fair 74.7% |
| Panamanians | 25.0 /100 | #197 | Fair 74.7% |
| Immigrants | Nigeria | 24.2 /100 | #198 | Fair 74.7% |
| Taiwanese | 23.2 /100 | #199 | Fair 74.7% |
| Nigerians | 21.9 /100 | #200 | Fair 74.7% |
| Choctaw | 21.4 /100 | #201 | Fair 74.7% |
| Moroccans | 20.4 /100 | #202 | Fair 74.7% |
| Immigrants | Northern Africa | 17.9 /100 | #203 | Poor 74.6% |
| Immigrants | Italy | 17.6 /100 | #204 | Poor 74.6% |
| Inupiat | 17.6 /100 | #205 | Poor 74.6% |
| Sioux | 17.5 /100 | #206 | Poor 74.6% |
| Albanians | 16.2 /100 | #207 | Poor 74.6% |
| Immigrants | Uruguay | 15.8 /100 | #208 | Poor 74.6% |
| Arabs | 15.8 /100 | #209 | Poor 74.6% |