Cape Verdean vs Luxembourger In Labor Force | Age 20-24
COMPARE
Cape Verdean
Luxembourger
In Labor Force | Age 20-24
In Labor Force | Age 20-24 Comparison
Cape Verdeans
Luxembourgers
78.3%
IN LABOR FORCE | AGE 20-24
100.0/ 100
METRIC RATING
17th/ 347
METRIC RANK
79.0%
IN LABOR FORCE | AGE 20-24
100.0/ 100
METRIC RATING
7th/ 347
METRIC RANK
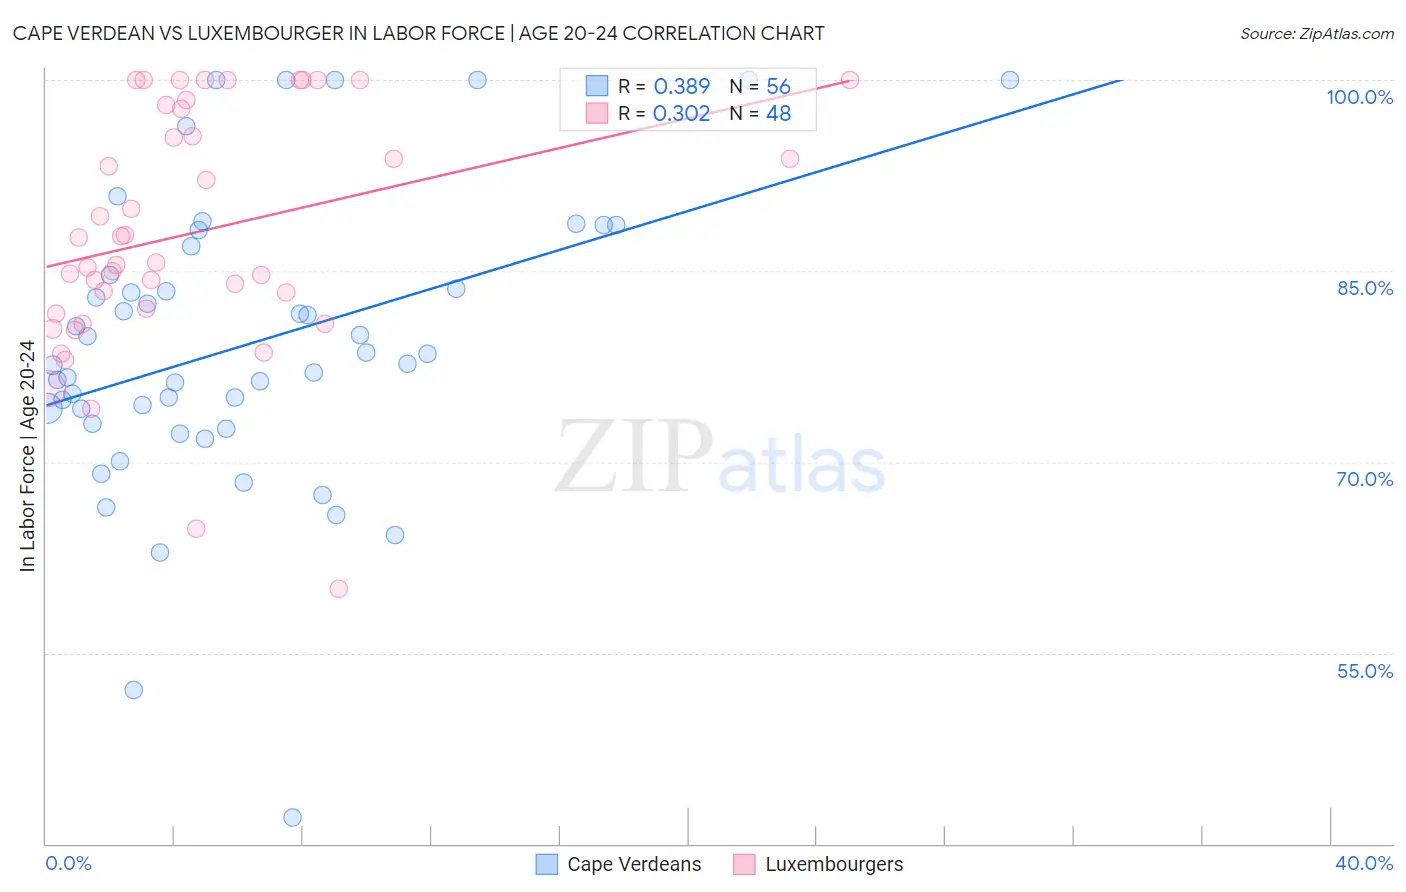
Cape Verdean vs Luxembourger In Labor Force | Age 20-24 Correlation Chart
The statistical analysis conducted on geographies consisting of 107,566,363 people shows a mild positive correlation between the proportion of Cape Verdeans and labor force participation rate among population between the ages 20 and 24 in the United States with a correlation coefficient (R) of 0.389 and weighted average of 78.3%. Similarly, the statistical analysis conducted on geographies consisting of 144,663,767 people shows a mild positive correlation between the proportion of Luxembourgers and labor force participation rate among population between the ages 20 and 24 in the United States with a correlation coefficient (R) of 0.302 and weighted average of 79.0%, a difference of 0.78%.
In Labor Force | Age 20-24 Correlation Summary
| Measurement | Cape Verdean | Luxembourger |
| Minimum | 42.1% | 60.0% |
| Maximum | 100.0% | 100.0% |
| Range | 57.9% | 40.0% |
| Mean | 79.3% | 88.1% |
| Median | 78.1% | 86.6% |
| Interquartile 25% (IQ1) | 73.6% | 81.9% |
| Interquartile 75% (IQ3) | 85.8% | 97.8% |
| Interquartile Range (IQR) | 12.2% | 16.0% |
| Standard Deviation (Sample) | 11.6% | 9.6% |
| Standard Deviation (Population) | 11.5% | 9.5% |
Demographics Similar to Cape Verdeans and Luxembourgers by In Labor Force | Age 20-24
In terms of in labor force | age 20-24, the demographic groups most similar to Cape Verdeans are Dutch (78.4%, a difference of 0.040%), Sudanese (78.4%, a difference of 0.090%), Czech (78.5%, a difference of 0.22%), Scandinavian (78.5%, a difference of 0.23%), and German (78.6%, a difference of 0.30%). Similarly, the demographic groups most similar to Luxembourgers are Danish (79.0%, a difference of 0.040%), Aleut (79.0%, a difference of 0.050%), Immigrants from Cabo Verde (78.9%, a difference of 0.10%), Swedish (78.8%, a difference of 0.17%), and Alaskan Athabascan (79.1%, a difference of 0.19%).
| Demographics | Rating | Rank | In Labor Force | Age 20-24 |
| Immigrants | Somalia | 100.0 /100 | #2 | Exceptional 79.5% |
| Somalis | 100.0 /100 | #3 | Exceptional 79.3% |
| Alaskan Athabascans | 100.0 /100 | #4 | Exceptional 79.1% |
| Aleuts | 100.0 /100 | #5 | Exceptional 79.0% |
| Danes | 100.0 /100 | #6 | Exceptional 79.0% |
| Luxembourgers | 100.0 /100 | #7 | Exceptional 79.0% |
| Immigrants | Cabo Verde | 100.0 /100 | #8 | Exceptional 78.9% |
| Swedes | 100.0 /100 | #9 | Exceptional 78.8% |
| Slovenes | 100.0 /100 | #10 | Exceptional 78.7% |
| Finns | 100.0 /100 | #11 | Exceptional 78.7% |
| Germans | 100.0 /100 | #12 | Exceptional 78.6% |
| Scandinavians | 100.0 /100 | #13 | Exceptional 78.5% |
| Czechs | 100.0 /100 | #14 | Exceptional 78.5% |
| Sudanese | 100.0 /100 | #15 | Exceptional 78.4% |
| Dutch | 100.0 /100 | #16 | Exceptional 78.4% |
| Cape Verdeans | 100.0 /100 | #17 | Exceptional 78.3% |
| Immigrants | Bosnia and Herzegovina | 100.0 /100 | #18 | Exceptional 78.1% |
| Bangladeshis | 100.0 /100 | #19 | Exceptional 78.1% |
| French Canadians | 100.0 /100 | #20 | Exceptional 78.1% |
| Puget Sound Salish | 100.0 /100 | #21 | Exceptional 78.0% |
| Pennsylvania Germans | 100.0 /100 | #22 | Exceptional 78.0% |