Bolivian vs Slovene In Labor Force | Age 35-44
COMPARE
Bolivian
Slovene
In Labor Force | Age 35-44
In Labor Force | Age 35-44 Comparison
Bolivians
Slovenes
86.1%
IN LABOR FORCE | AGE 35-44
100.0/ 100
METRIC RATING
6th/ 347
METRIC RANK
85.6%
IN LABOR FORCE | AGE 35-44
100.0/ 100
METRIC RATING
19th/ 347
METRIC RANK
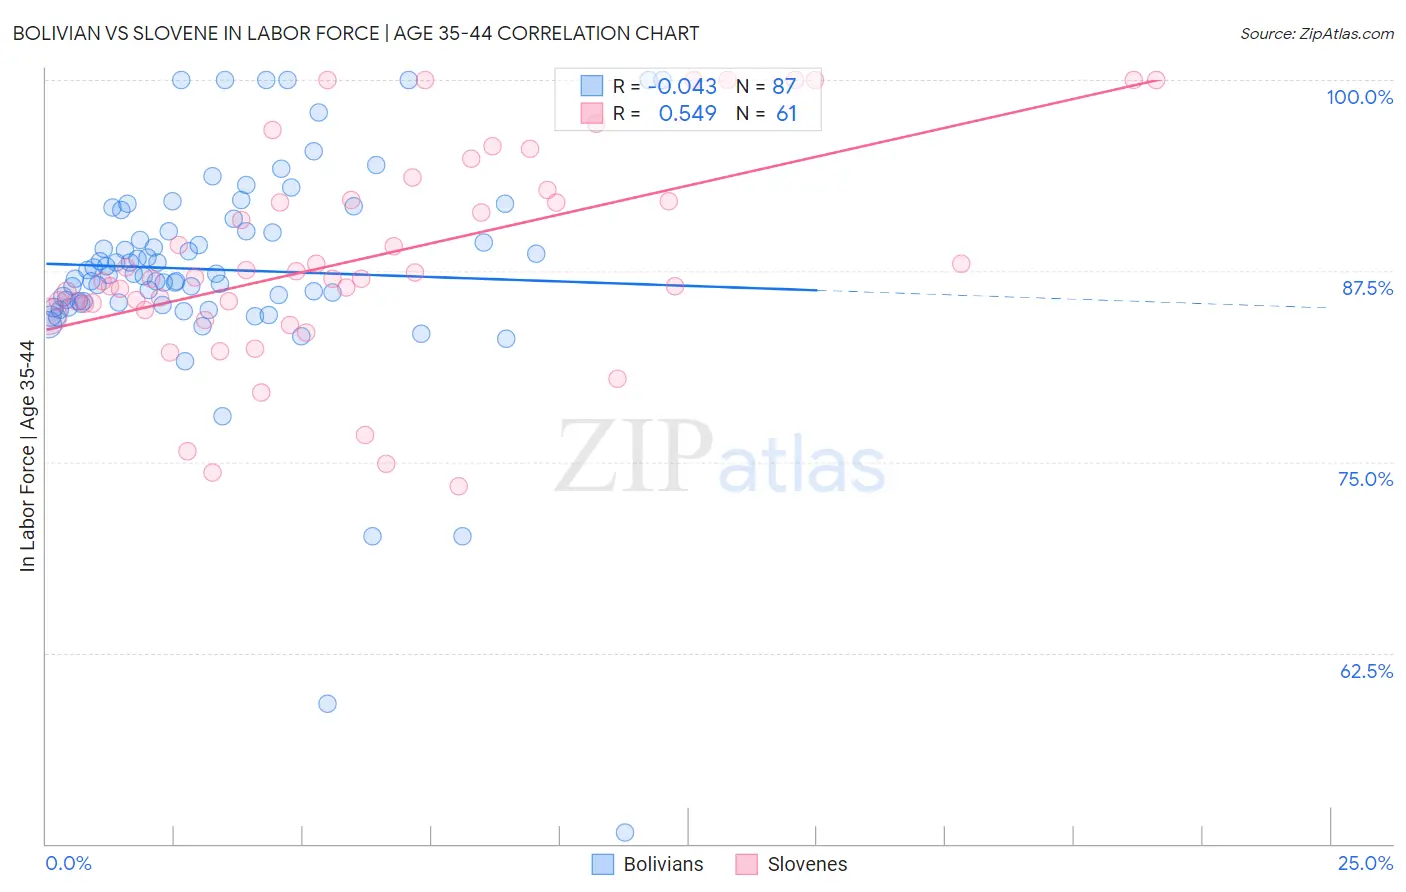
Bolivian vs Slovene In Labor Force | Age 35-44 Correlation Chart
The statistical analysis conducted on geographies consisting of 184,652,414 people shows no correlation between the proportion of Bolivians and labor force participation rate among population between the ages 35 and 44 in the United States with a correlation coefficient (R) of -0.043 and weighted average of 86.1%. Similarly, the statistical analysis conducted on geographies consisting of 261,289,238 people shows a substantial positive correlation between the proportion of Slovenes and labor force participation rate among population between the ages 35 and 44 in the United States with a correlation coefficient (R) of 0.549 and weighted average of 85.6%, a difference of 0.61%.
In Labor Force | Age 35-44 Correlation Summary
| Measurement | Bolivian | Slovene |
| Minimum | 50.7% | 73.4% |
| Maximum | 100.0% | 100.0% |
| Range | 49.3% | 26.6% |
| Mean | 87.6% | 88.4% |
| Median | 87.3% | 87.0% |
| Interquartile 25% (IQ1) | 85.4% | 85.1% |
| Interquartile 75% (IQ3) | 90.9% | 92.5% |
| Interquartile Range (IQR) | 5.5% | 7.3% |
| Standard Deviation (Sample) | 7.4% | 6.9% |
| Standard Deviation (Population) | 7.4% | 6.8% |
Demographics Similar to Bolivians and Slovenes by In Labor Force | Age 35-44
In terms of in labor force | age 35-44, the demographic groups most similar to Bolivians are Zimbabwean (86.1%, a difference of 0.010%), Immigrants from Sierra Leone (86.1%, a difference of 0.040%), Immigrants from Cabo Verde (86.2%, a difference of 0.14%), Immigrants from Bolivia (86.2%, a difference of 0.17%), and Immigrants from Ethiopia (85.9%, a difference of 0.21%). Similarly, the demographic groups most similar to Slovenes are Immigrants from North Macedonia (85.6%, a difference of 0.0%), Carpatho Rusyn (85.6%, a difference of 0.0%), Immigrants from Serbia (85.5%, a difference of 0.040%), Norwegian (85.6%, a difference of 0.050%), and Immigrants from Ireland (85.6%, a difference of 0.050%).
| Demographics | Rating | Rank | In Labor Force | Age 35-44 |
| Luxembourgers | 100.0 /100 | #2 | Exceptional 86.4% |
| Immigrants | Bolivia | 100.0 /100 | #3 | Exceptional 86.2% |
| Immigrants | Cabo Verde | 100.0 /100 | #4 | Exceptional 86.2% |
| Zimbabweans | 100.0 /100 | #5 | Exceptional 86.1% |
| Bolivians | 100.0 /100 | #6 | Exceptional 86.1% |
| Immigrants | Sierra Leone | 100.0 /100 | #7 | Exceptional 86.1% |
| Immigrants | Ethiopia | 100.0 /100 | #8 | Exceptional 85.9% |
| Ethiopians | 100.0 /100 | #9 | Exceptional 85.9% |
| Cape Verdeans | 100.0 /100 | #10 | Exceptional 85.8% |
| Immigrants | Cameroon | 100.0 /100 | #11 | Exceptional 85.8% |
| Liberians | 100.0 /100 | #12 | Exceptional 85.7% |
| Somalis | 100.0 /100 | #13 | Exceptional 85.6% |
| Immigrants | Somalia | 100.0 /100 | #14 | Exceptional 85.6% |
| Norwegians | 100.0 /100 | #15 | Exceptional 85.6% |
| Immigrants | Ireland | 100.0 /100 | #16 | Exceptional 85.6% |
| Immigrants | North Macedonia | 100.0 /100 | #17 | Exceptional 85.6% |
| Carpatho Rusyns | 100.0 /100 | #18 | Exceptional 85.6% |
| Slovenes | 100.0 /100 | #19 | Exceptional 85.6% |
| Immigrants | Serbia | 100.0 /100 | #20 | Exceptional 85.5% |
| Bulgarians | 100.0 /100 | #21 | Exceptional 85.5% |
| Immigrants | Bosnia and Herzegovina | 100.0 /100 | #22 | Exceptional 85.4% |