Bahamian vs Immigrants from Malaysia In Labor Force | Age 25-29

COMPARE

Bahamian
Race
Ancestry
AfghanAfricanAlaska NativeAlaskan AthabascanAlbanianAleutAlsatianAmericanApacheArabArapahoArgentineanArmenianAssyrian/Chaldean/SyriacAustralianAustrianBahamianBangladeshiBarbadianBasqueBelgianBelizeanBermudanBhutaneseBlackfeetBolivianBrazilianBritishBritish West IndianBulgarianBurmeseCajunCambodianCanadianCape VerdeanCarpatho RusynCelticCentral AmericanCentral American IndianCherokeeCheyenneChickasawChileanChineseChippewaChoctawColombianColvilleComancheCosta RicanCreeCreekCroatianCrowCubanCypriotCzechCzechoslovakianDanishDelawareDominicanDutchDutch West IndianEastern EuropeanEcuadorianEgyptianEnglishEstonianEthiopianEuropeanFijianFilipinoFinnishFrenchFrench American IndianFrench CanadianGermanGerman RussianGhanaianGreekGuamanian/ChamorroGuatemalanGuyaneseHaitianHmongHonduranHopiHoumaHungarianIcelanderIndian (Asian)IndonesianInupiatIranianIraqiIrishIroquoisIsraeliItalianJamaicanJapaneseJordanianKenyanKiowaKoreanLaotianLatvianLebaneseLiberianLithuanianLumbeeLuxembourgerMacedonianMalaysianMalteseMarshalleseMenomineeMexicanMexican American IndianMongolianMoroccanNative HawaiianNavajoNepaleseNew ZealanderNicaraguanNigerianNorthern EuropeanNorwegianOkinawanOsageOttawaPaiutePakistaniPalestinianPanamanianParaguayanPennsylvania GermanPeruvianPimaPolishPortuguesePotawatomiPuebloPuerto RicanPuget Sound SalishRomanianRussianSalvadoranSamoanScandinavianScotch-IrishScottishSeminoleSenegaleseSerbianShoshoneSierra LeoneanSiouxSlavicSlovakSloveneSomaliSouth AfricanSouth AmericanSouth American IndianSoviet UnionSpaniardSpanishSpanish AmericanSpanish American IndianSri LankanSubsaharan AfricanSudaneseSwedishSwissSyrianTaiwaneseThaiTlingit-HaidaTohono O'OdhamTonganTrinidadian and TobagonianTsimshianTurkishU.S. Virgin IslanderUgandanUkrainianUruguayanUteVenezuelanVietnameseWelshWest IndianYakamaYaquiYugoslavianYumanYup'ikZimbabwean
Immigration
NonimmigrantsImmigrantsAfghanistanAfricaAlbaniaArgentinaArmeniaAsiaAustraliaAustriaBahamasBangladeshBarbadosBelarusBelgiumBelizeBoliviaBosnia and HerzegovinaBrazilBulgariaBurma/MyanmarCabo VerdeCambodiaCameroonCanadaCaribbeanCentral AmericaChileChinaColombiaCongoCosta RicaCroatiaCubaCzechoslovakiaDenmarkDominicaDominican RepublicEastern AfricaEastern AsiaEastern EuropeEcuadorEgyptEl SalvadorEnglandEritreaEthiopiaEuropeFijiFranceGermanyGhanaGreeceGrenadaGuatemalaGuyanaHaitiHondurasHong KongHungaryIndiaIndonesiaIranIraqIrelandIsraelItalyJamaicaJapanJordanKazakhstanKenyaKoreaKuwaitLaosLatin AmericaLatviaLebanonLiberiaLithuaniaMexicoMicronesiaMiddle AfricaMoldovaMoroccoNepalNetherlandsNicaraguaNigeriaNorth AmericaNorth MacedoniaNorthern AfricaNorthern EuropeNorwayOceaniaPakistanPanamaPeruPhilippinesPolandPortugalRomaniaRussiaSaudi ArabiaScotlandSenegalSerbiaSierra LeoneSingaporeSomaliaSouth AfricaSouth AmericaSouth Central AsiaSouth Eastern AsiaSouthern EuropeSpainSri LankaSt. Vincent and the GrenadinesSudanSwedenSwitzerlandSyriaTaiwanThailandTrinidad and TobagoTurkeyUgandaUkraineUruguayUzbekistanVenezuelaVietnamWest IndiesWestern AfricaWestern AsiaWestern EuropeYemenZaireZimbabweAzores
Immigrants from Malaysia
Race
Ancestry
AfghanAfricanAlaska NativeAlaskan AthabascanAlbanianAleutAlsatianAmericanApacheArabArapahoArgentineanArmenianAssyrian/Chaldean/SyriacAustralianAustrianBangladeshiBarbadianBasqueBelgianBelizeanBermudanBhutaneseBlackfeetBolivianBrazilianBritishBritish West IndianBulgarianBurmeseCajunCambodianCanadianCape VerdeanCarpatho RusynCelticCentral AmericanCentral American IndianCherokeeCheyenneChickasawChileanChineseChippewaChoctawColombianColvilleComancheCosta RicanCreeCreekCroatianCrowCubanCypriotCzechCzechoslovakianDanishDelawareDominicanDutchDutch West IndianEastern EuropeanEcuadorianEgyptianEnglishEstonianEthiopianEuropeanFijianFilipinoFinnishFrenchFrench American IndianFrench CanadianGermanGerman RussianGhanaianGreekGuamanian/ChamorroGuatemalanGuyaneseHaitianHmongHonduranHopiHoumaHungarianIcelanderIndian (Asian)IndonesianInupiatIranianIraqiIrishIroquoisIsraeliItalianJamaicanJapaneseJordanianKenyanKiowaKoreanLaotianLatvianLebaneseLiberianLithuanianLumbeeLuxembourgerMacedonianMalaysianMalteseMarshalleseMenomineeMexicanMexican American IndianMongolianMoroccanNative HawaiianNavajoNepaleseNew ZealanderNicaraguanNigerianNorthern EuropeanNorwegianOkinawanOsageOttawaPaiutePakistaniPalestinianPanamanianParaguayanPennsylvania GermanPeruvianPimaPolishPortuguesePotawatomiPuebloPuerto RicanPuget Sound SalishRomanianRussianSalvadoranSamoanScandinavianScotch-IrishScottishSeminoleSenegaleseSerbianShoshoneSierra LeoneanSiouxSlavicSlovakSloveneSomaliSouth AfricanSouth AmericanSouth American IndianSoviet UnionSpaniardSpanishSpanish AmericanSpanish American IndianSri LankanSubsaharan AfricanSudaneseSwedishSwissSyrianTaiwaneseThaiTlingit-HaidaTohono O'OdhamTonganTrinidadian and TobagonianTsimshianTurkishU.S. Virgin IslanderUgandanUkrainianUruguayanUteVenezuelanVietnameseWelshWest IndianYakamaYaquiYugoslavianYumanYup'ikZimbabwean
Immigration
NonimmigrantsImmigrantsAfghanistanAfricaAlbaniaArgentinaArmeniaAsiaAustraliaAustriaBahamasBangladeshBarbadosBelarusBelgiumBelizeBoliviaBosnia and HerzegovinaBrazilBulgariaBurma/MyanmarCabo VerdeCambodiaCameroonCanadaCaribbeanCentral AmericaChileChinaColombiaCongoCosta RicaCroatiaCubaCzechoslovakiaDenmarkDominicaDominican RepublicEastern AfricaEastern AsiaEastern EuropeEcuadorEgyptEl SalvadorEnglandEritreaEthiopiaEuropeFijiFranceGermanyGhanaGreeceGrenadaGuatemalaGuyanaHaitiHondurasHong KongHungaryIndiaIndonesiaIranIraqIrelandIsraelItalyJamaicaJapanJordanKazakhstanKenyaKoreaKuwaitLaosLatin AmericaLatviaLebanonLiberiaLithuaniaMalaysiaMexicoMicronesiaMiddle AfricaMoldovaMoroccoNepalNetherlandsNicaraguaNigeriaNorth AmericaNorth MacedoniaNorthern AfricaNorthern EuropeNorwayOceaniaPakistanPanamaPeruPhilippinesPolandPortugalRomaniaRussiaSaudi ArabiaScotlandSenegalSerbiaSierra LeoneSingaporeSomaliaSouth AfricaSouth AmericaSouth Central AsiaSouth Eastern AsiaSouthern EuropeSpainSri LankaSt. Vincent and the GrenadinesSudanSwedenSwitzerlandSyriaTaiwanThailandTrinidad and TobagoTurkeyUgandaUkraineUruguayUzbekistanVenezuelaVietnamWest IndiesWestern AfricaWestern AsiaWestern EuropeYemenZaireZimbabweAzores
In Labor Force | Age 25-29
Income
Poverty
Unemployment
Labor Participation
Family Structure
Vehicle Availability
Education Level
Disability

In Labor Force | Age 25-29 Comparison

Bahamians

Immigrants from Malaysia

Tragic
Exceptional
83.7%
IN LABOR FORCE | AGE 25-29
0.2/ 100
METRIC RATING
251st/ 347
METRIC RANK
85.0%
IN LABOR FORCE | AGE 25-29
90.4/ 100
METRIC RATING
114th/ 347
METRIC RANK

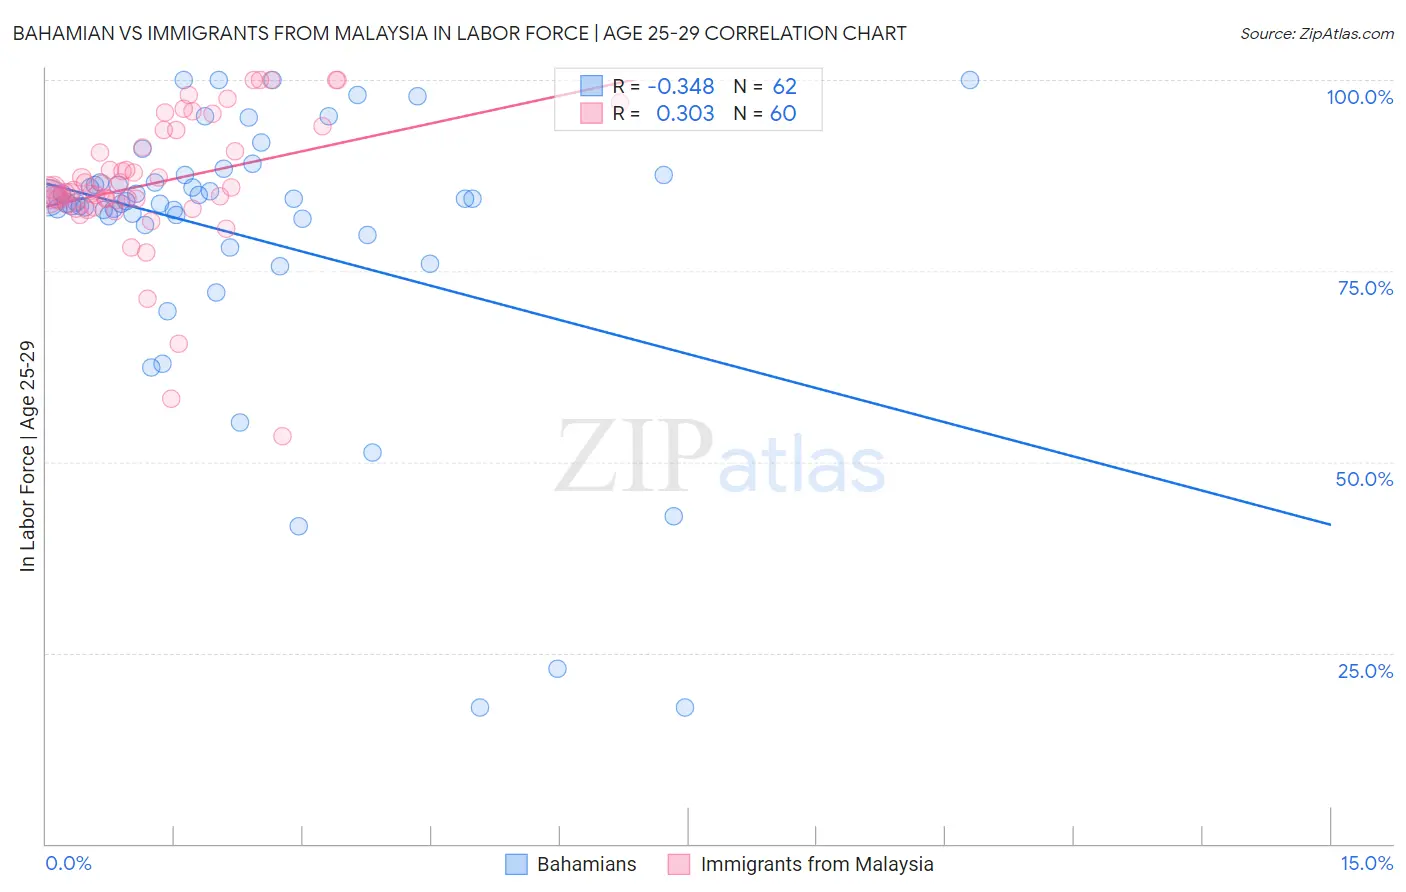
Bahamian vs Immigrants from Malaysia In Labor Force | Age 25-29 Correlation Chart

The statistical analysis conducted on geographies consisting of 112,690,388 people shows a mild negative correlation between the proportion of Bahamians and labor force participation rate among population between the ages 25 and 29 in the United States with a correlation coefficient (R) of -0.348 and weighted average of 83.7%. Similarly, the statistical analysis conducted on geographies consisting of 197,964,000 people shows a mild positive correlation between the proportion of Immigrants from Malaysia and labor force participation rate among population between the ages 25 and 29 in the United States with a correlation coefficient (R) of 0.303 and weighted average of 85.0%, a difference of 1.6%.
Bahamian vs Immigrants from Malaysia In Labor Force | Age 25-29

In Labor Force | Age 25-29 Correlation Summary

MeasurementBahamianImmigrants from Malaysia
Minimum17.9%53.3%
Maximum100.0%100.0%
Range82.1%46.7%
Mean79.6%86.5%
Median84.1%85.4%
Interquartile 25% (IQ1)81.1%83.9%
Interquartile 75% (IQ3)86.5%92.3%
Interquartile Range (IQR)5.5%8.4%
Standard Deviation (Sample)18.2%9.0%
Standard Deviation (Population)18.0%8.9%

Similar Demographics by In Labor Force | Age 25-29

Demographics Similar to Bahamians by In Labor Force | Age 25-29

In terms of in labor force | age 25-29, the demographic groups most similar to Bahamians are Guatemalan (83.7%, a difference of 0.010%), Immigrants from Trinidad and Tobago (83.7%, a difference of 0.010%), Spaniard (83.7%, a difference of 0.010%), Central American (83.7%, a difference of 0.020%), and Hmong (83.7%, a difference of 0.030%).
DemographicsRating | RankIn Labor Force | Age 25-29
Immigrants | Jamaica
0.4
/100
|
#244
Tragic
83.8%
Iroquois
0.4
/100
|
#245
Tragic
83.8%
Cree
0.3
/100
|
#246
Tragic
83.8%
Immigrants | El Salvador
0.3
/100
|
#247
Tragic
83.7%
Immigrants | Nonimmigrants
0.3
/100
|
#248
Tragic
83.7%
Hmong
0.3
/100
|
#249
Tragic
83.7%
Central Americans
0.2
/100
|
#250
Tragic
83.7%
Bahamians
0.2
/100
|
#251
Tragic
83.7%
Guatemalans
0.2
/100
|
#252
Tragic
83.7%
Immigrants | Trinidad and Tobago
0.2
/100
|
#253
Tragic
83.7%
Spaniards
0.2
/100
|
#254
Tragic
83.7%
Haitians
0.2
/100
|
#255
Tragic
83.7%
Immigrants | Haiti
0.2
/100
|
#256
Tragic
83.7%
Delaware
0.2
/100
|
#257
Tragic
83.7%
Immigrants | Guatemala
0.1
/100
|
#258
Tragic
83.6%

Demographics Similar to Immigrants from Malaysia by In Labor Force | Age 25-29

In terms of in labor force | age 25-29, the demographic groups most similar to Immigrants from Malaysia are Senegalese (85.0%, a difference of 0.010%), Irish (85.0%, a difference of 0.010%), Immigrants from Middle Africa (85.0%, a difference of 0.020%), Immigrants from Austria (85.0%, a difference of 0.030%), and Costa Rican (85.0%, a difference of 0.030%).
DemographicsRating | RankIn Labor Force | Age 25-29
Immigrants | Southern Europe
92.3
/100
|
#107
Exceptional
85.0%
Immigrants | Austria
91.9
/100
|
#108
Exceptional
85.0%
Costa Ricans
91.9
/100
|
#109
Exceptional
85.0%
New Zealanders
91.5
/100
|
#110
Exceptional
85.0%
Immigrants | Middle Africa
91.4
/100
|
#111
Exceptional
85.0%
Senegalese
90.9
/100
|
#112
Exceptional
85.0%
Irish
90.6
/100
|
#113
Exceptional
85.0%
Immigrants | Malaysia
90.4
/100
|
#114
Exceptional
85.0%
South Africans
88.9
/100
|
#115
Excellent
85.0%
Chileans
88.8
/100
|
#116
Excellent
85.0%
Immigrants | Belarus
88.0
/100
|
#117
Excellent
85.0%
Finns
87.8
/100
|
#118
Excellent
85.0%
Filipinos
87.1
/100
|
#119
Excellent
84.9%
Immigrants | South Africa
86.1
/100
|
#120
Excellent
84.9%
Immigrants | Chile
85.6
/100
|
#121
Excellent
84.9%