Australian vs Immigrants from Eastern Europe In Labor Force | Age 16-19

COMPARE

Australian
Race
Ancestry
AfghanAfricanAlaska NativeAlaskan AthabascanAlbanianAleutAlsatianAmericanApacheArabArapahoArgentineanArmenianAssyrian/Chaldean/SyriacAustralianAustrianBahamianBangladeshiBarbadianBasqueBelgianBelizeanBermudanBhutaneseBlackfeetBolivianBrazilianBritishBritish West IndianBulgarianBurmeseCajunCambodianCanadianCape VerdeanCarpatho RusynCelticCentral AmericanCentral American IndianCherokeeCheyenneChickasawChileanChineseChippewaChoctawColombianColvilleComancheCosta RicanCreeCreekCroatianCrowCubanCypriotCzechCzechoslovakianDanishDelawareDominicanDutchDutch West IndianEastern EuropeanEcuadorianEgyptianEnglishEstonianEthiopianEuropeanFijianFilipinoFinnishFrenchFrench American IndianFrench CanadianGermanGerman RussianGhanaianGreekGuamanian/ChamorroGuatemalanGuyaneseHaitianHmongHonduranHopiHoumaHungarianIcelanderIndian (Asian)IndonesianInupiatIranianIraqiIrishIroquoisIsraeliItalianJamaicanJapaneseJordanianKenyanKiowaKoreanLaotianLatvianLebaneseLiberianLithuanianLumbeeLuxembourgerMacedonianMalaysianMalteseMarshalleseMenomineeMexicanMexican American IndianMongolianMoroccanNative HawaiianNavajoNepaleseNew ZealanderNicaraguanNigerianNorthern EuropeanNorwegianOkinawanOsageOttawaPaiutePakistaniPalestinianPanamanianParaguayanPennsylvania GermanPeruvianPimaPolishPortuguesePotawatomiPuebloPuerto RicanPuget Sound SalishRomanianRussianSalvadoranSamoanScandinavianScotch-IrishScottishSeminoleSenegaleseSerbianShoshoneSierra LeoneanSiouxSlavicSlovakSloveneSomaliSouth AfricanSouth AmericanSouth American IndianSoviet UnionSpaniardSpanishSpanish AmericanSpanish American IndianSri LankanSubsaharan AfricanSudaneseSwedishSwissSyrianTaiwaneseThaiTlingit-HaidaTohono O'OdhamTonganTrinidadian and TobagonianTsimshianTurkishU.S. Virgin IslanderUgandanUkrainianUruguayanUteVenezuelanVietnameseWelshWest IndianYakamaYaquiYugoslavianYumanYup'ikZimbabwean
Immigration
NonimmigrantsImmigrantsAfghanistanAfricaAlbaniaArgentinaArmeniaAsiaAustraliaAustriaBahamasBangladeshBarbadosBelarusBelgiumBelizeBoliviaBosnia and HerzegovinaBrazilBulgariaBurma/MyanmarCabo VerdeCambodiaCameroonCanadaCaribbeanCentral AmericaChileChinaColombiaCongoCosta RicaCroatiaCubaCzechoslovakiaDenmarkDominicaDominican RepublicEastern AfricaEastern AsiaEcuadorEgyptEl SalvadorEnglandEritreaEthiopiaEuropeFijiFranceGermanyGhanaGreeceGrenadaGuatemalaGuyanaHaitiHondurasHong KongHungaryIndiaIndonesiaIranIraqIrelandIsraelItalyJamaicaJapanJordanKazakhstanKenyaKoreaKuwaitLaosLatin AmericaLatviaLebanonLiberiaLithuaniaMalaysiaMexicoMicronesiaMiddle AfricaMoldovaMoroccoNepalNetherlandsNicaraguaNigeriaNorth AmericaNorth MacedoniaNorthern AfricaNorthern EuropeNorwayOceaniaPakistanPanamaPeruPhilippinesPolandPortugalRomaniaRussiaSaudi ArabiaScotlandSenegalSerbiaSierra LeoneSingaporeSomaliaSouth AfricaSouth AmericaSouth Central AsiaSouth Eastern AsiaSouthern EuropeSpainSri LankaSt. Vincent and the GrenadinesSudanSwedenSwitzerlandSyriaTaiwanThailandTrinidad and TobagoTurkeyUgandaUkraineUruguayUzbekistanVenezuelaVietnamWest IndiesWestern AfricaWestern AsiaWestern EuropeYemenZaireZimbabweAzores
Immigrants from Eastern Europe
Race
Ancestry
AfghanAfricanAlaska NativeAlaskan AthabascanAlbanianAleutAlsatianAmericanApacheArabArapahoArgentineanArmenianAssyrian/Chaldean/SyriacAustrianBahamianBangladeshiBarbadianBasqueBelgianBelizeanBermudanBhutaneseBlackfeetBolivianBrazilianBritishBritish West IndianBulgarianBurmeseCajunCambodianCanadianCape VerdeanCarpatho RusynCelticCentral AmericanCentral American IndianCherokeeCheyenneChickasawChileanChineseChippewaChoctawColombianColvilleComancheCosta RicanCreeCreekCroatianCrowCubanCypriotCzechCzechoslovakianDanishDelawareDominicanDutchDutch West IndianEastern EuropeanEcuadorianEgyptianEnglishEstonianEthiopianEuropeanFijianFilipinoFinnishFrenchFrench American IndianFrench CanadianGermanGerman RussianGhanaianGreekGuamanian/ChamorroGuatemalanGuyaneseHaitianHmongHonduranHopiHoumaHungarianIcelanderIndian (Asian)IndonesianInupiatIranianIraqiIrishIroquoisIsraeliItalianJamaicanJapaneseJordanianKenyanKiowaKoreanLaotianLatvianLebaneseLiberianLithuanianLumbeeLuxembourgerMacedonianMalaysianMalteseMarshalleseMenomineeMexicanMexican American IndianMongolianMoroccanNative HawaiianNavajoNepaleseNew ZealanderNicaraguanNigerianNorthern EuropeanNorwegianOkinawanOsageOttawaPaiutePakistaniPalestinianPanamanianParaguayanPennsylvania GermanPeruvianPimaPolishPortuguesePotawatomiPuebloPuerto RicanPuget Sound SalishRomanianRussianSalvadoranSamoanScandinavianScotch-IrishScottishSeminoleSenegaleseSerbianShoshoneSierra LeoneanSiouxSlavicSlovakSloveneSomaliSouth AfricanSouth AmericanSouth American IndianSoviet UnionSpaniardSpanishSpanish AmericanSpanish American IndianSri LankanSubsaharan AfricanSudaneseSwedishSwissSyrianTaiwaneseThaiTlingit-HaidaTohono O'OdhamTonganTrinidadian and TobagonianTsimshianTurkishU.S. Virgin IslanderUgandanUkrainianUruguayanUteVenezuelanVietnameseWelshWest IndianYakamaYaquiYugoslavianYumanYup'ikZimbabwean
Immigration
NonimmigrantsImmigrantsAfghanistanAfricaAlbaniaArgentinaArmeniaAsiaAustraliaAustriaBahamasBangladeshBarbadosBelarusBelgiumBelizeBoliviaBosnia and HerzegovinaBrazilBulgariaBurma/MyanmarCabo VerdeCambodiaCameroonCanadaCaribbeanCentral AmericaChileChinaColombiaCongoCosta RicaCroatiaCubaCzechoslovakiaDenmarkDominicaDominican RepublicEastern AfricaEastern AsiaEastern EuropeEcuadorEgyptEl SalvadorEnglandEritreaEthiopiaEuropeFijiFranceGermanyGhanaGreeceGrenadaGuatemalaGuyanaHaitiHondurasHong KongHungaryIndiaIndonesiaIranIraqIrelandIsraelItalyJamaicaJapanJordanKazakhstanKenyaKoreaKuwaitLaosLatin AmericaLatviaLebanonLiberiaLithuaniaMalaysiaMexicoMicronesiaMiddle AfricaMoldovaMoroccoNepalNetherlandsNicaraguaNigeriaNorth AmericaNorth MacedoniaNorthern AfricaNorthern EuropeNorwayOceaniaPakistanPanamaPeruPhilippinesPolandPortugalRomaniaRussiaSaudi ArabiaScotlandSenegalSerbiaSierra LeoneSingaporeSomaliaSouth AfricaSouth AmericaSouth Central AsiaSouth Eastern AsiaSouthern EuropeSpainSri LankaSt. Vincent and the GrenadinesSudanSwedenSwitzerlandSyriaTaiwanThailandTrinidad and TobagoTurkeyUgandaUkraineUruguayUzbekistanVenezuelaVietnamWest IndiesWestern AfricaWestern AsiaWestern EuropeYemenZaireZimbabweAzores
In Labor Force | Age 16-19
Income
Poverty
Unemployment
Labor Participation
Family Structure
Vehicle Availability
Education Level
Disability

In Labor Force | Age 16-19 Comparison

Australians

Immigrants from Eastern Europe

Exceptional
Poor
37.8%
IN LABOR FORCE | AGE 16-19
93.2/ 100
METRIC RATING
136th/ 347
METRIC RANK
35.8%
IN LABOR FORCE | AGE 16-19
14.5/ 100
METRIC RATING
207th/ 347
METRIC RANK

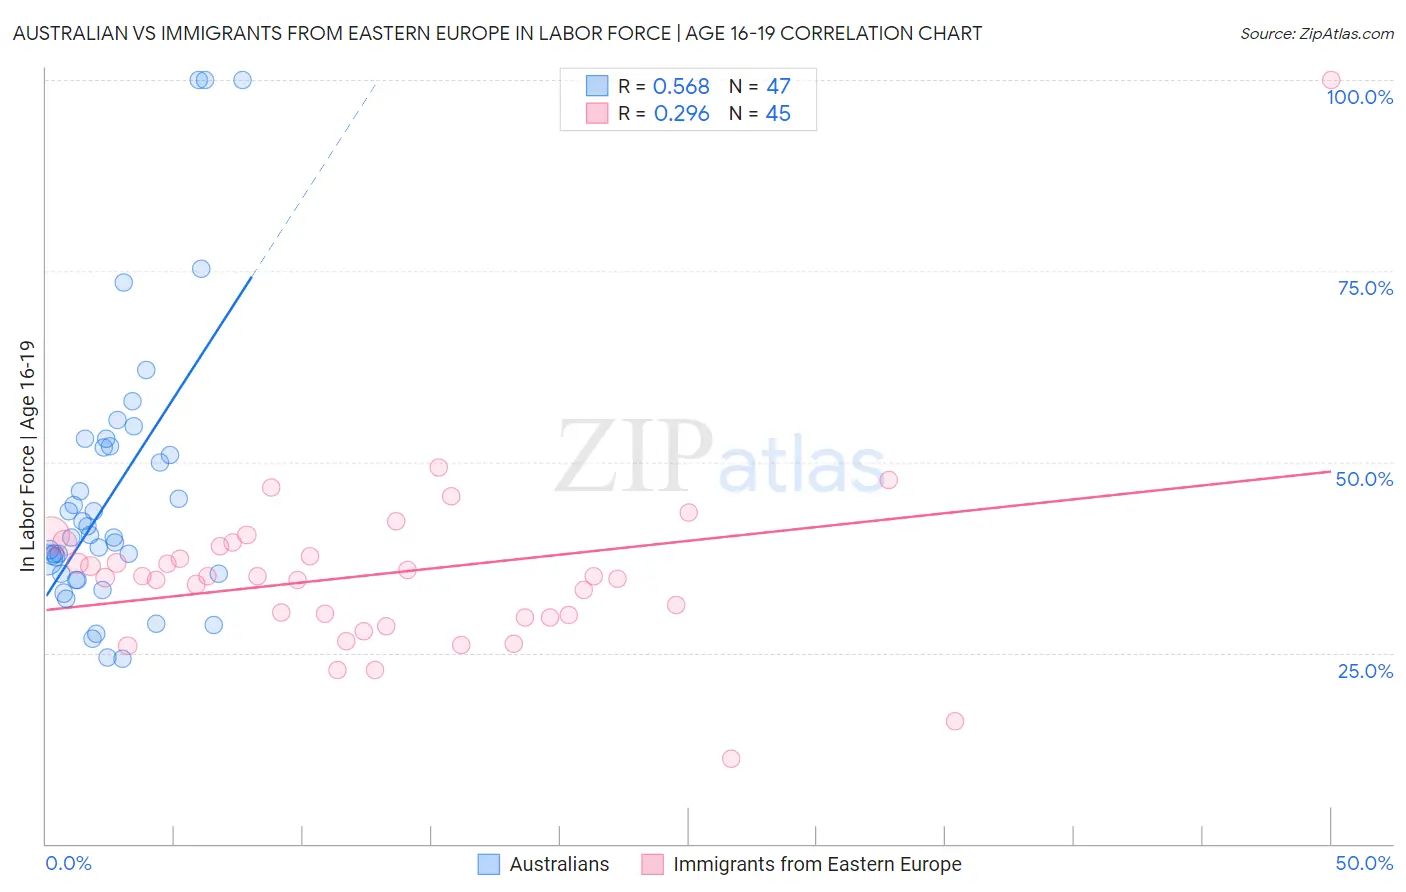
Australian vs Immigrants from Eastern Europe In Labor Force | Age 16-19 Correlation Chart

The statistical analysis conducted on geographies consisting of 223,900,853 people shows a substantial positive correlation between the proportion of Australians and labor force participation rate among population between the ages 16 and 19 in the United States with a correlation coefficient (R) of 0.568 and weighted average of 37.8%. Similarly, the statistical analysis conducted on geographies consisting of 474,546,835 people shows a weak positive correlation between the proportion of Immigrants from Eastern Europe and labor force participation rate among population between the ages 16 and 19 in the United States with a correlation coefficient (R) of 0.296 and weighted average of 35.8%, a difference of 5.7%.
Australian vs Immigrants from Eastern Europe In Labor Force | Age 16-19

In Labor Force | Age 16-19 Correlation Summary

MeasurementAustralianImmigrants from Eastern Europe
Minimum24.2%11.2%
Maximum100.0%100.0%
Range75.8%88.8%
Mean45.9%35.4%
Median40.1%35.0%
Interquartile 25% (IQ1)35.3%29.6%
Interquartile 75% (IQ3)52.1%39.2%
Interquartile Range (IQR)16.8%9.6%
Standard Deviation (Sample)18.1%12.5%
Standard Deviation (Population)17.9%12.4%

Similar Demographics by In Labor Force | Age 16-19

Demographics Similar to Australians by In Labor Force | Age 16-19

In terms of in labor force | age 16-19, the demographic groups most similar to Australians are Cajun (37.8%, a difference of 0.0%), Macedonian (37.8%, a difference of 0.030%), Immigrants from Netherlands (37.8%, a difference of 0.090%), Comanche (37.7%, a difference of 0.23%), and Immigrants from Moldova (37.7%, a difference of 0.24%).
DemographicsRating | RankIn Labor Force | Age 16-19
Spaniards
95.5
/100
|
#129
Exceptional
38.0%
Immigrants | Zimbabwe
95.4
/100
|
#130
Exceptional
38.0%
Immigrants | Austria
95.0
/100
|
#131
Exceptional
37.9%
Immigrants | Oceania
94.7
/100
|
#132
Exceptional
37.9%
Cheyenne
94.6
/100
|
#133
Exceptional
37.9%
Immigrants | Netherlands
93.7
/100
|
#134
Exceptional
37.8%
Macedonians
93.4
/100
|
#135
Exceptional
37.8%
Australians
93.2
/100
|
#136
Exceptional
37.8%
Cajuns
93.2
/100
|
#137
Exceptional
37.8%
Comanche
91.9
/100
|
#138
Exceptional
37.7%
Immigrants | Moldova
91.9
/100
|
#139
Exceptional
37.7%
Estonians
91.7
/100
|
#140
Exceptional
37.7%
Syrians
90.7
/100
|
#141
Exceptional
37.6%
Sierra Leoneans
89.7
/100
|
#142
Excellent
37.6%
Pakistanis
89.5
/100
|
#143
Excellent
37.6%

Demographics Similar to Immigrants from Eastern Europe by In Labor Force | Age 16-19

In terms of in labor force | age 16-19, the demographic groups most similar to Immigrants from Eastern Europe are South American Indian (35.8%, a difference of 0.020%), Chilean (35.8%, a difference of 0.020%), Immigrants from Albania (35.8%, a difference of 0.050%), Korean (35.7%, a difference of 0.12%), and Moroccan (35.7%, a difference of 0.19%).
DemographicsRating | RankIn Labor Force | Age 16-19
Immigrants | Sweden
18.8
/100
|
#200
Poor
35.9%
Alsatians
17.5
/100
|
#201
Poor
35.9%
Senegalese
17.4
/100
|
#202
Poor
35.9%
Immigrants | Nigeria
16.8
/100
|
#203
Poor
35.8%
Immigrants | Albania
15.0
/100
|
#204
Poor
35.8%
South American Indians
14.6
/100
|
#205
Poor
35.8%
Chileans
14.6
/100
|
#206
Poor
35.8%
Immigrants | Eastern Europe
14.5
/100
|
#207
Poor
35.8%
Koreans
13.3
/100
|
#208
Poor
35.7%
Moroccans
12.7
/100
|
#209
Poor
35.7%
Immigrants | Switzerland
11.9
/100
|
#210
Poor
35.6%
Mexicans
11.9
/100
|
#211
Poor
35.6%
Houma
11.0
/100
|
#212
Poor
35.6%
Immigrants | Bolivia
11.0
/100
|
#213
Poor
35.6%
Apache
11.0
/100
|
#214
Poor
35.6%