Arab vs Immigrants from Grenada In Labor Force | Age 20-24
COMPARE
Arab
Immigrants from Grenada
In Labor Force | Age 20-24
In Labor Force | Age 20-24 Comparison
Arabs
Immigrants from Grenada
74.6%
IN LABOR FORCE | AGE 20-24
15.8/ 100
METRIC RATING
209th/ 347
METRIC RANK
67.2%
IN LABOR FORCE | AGE 20-24
0.0/ 100
METRIC RATING
344th/ 347
METRIC RANK
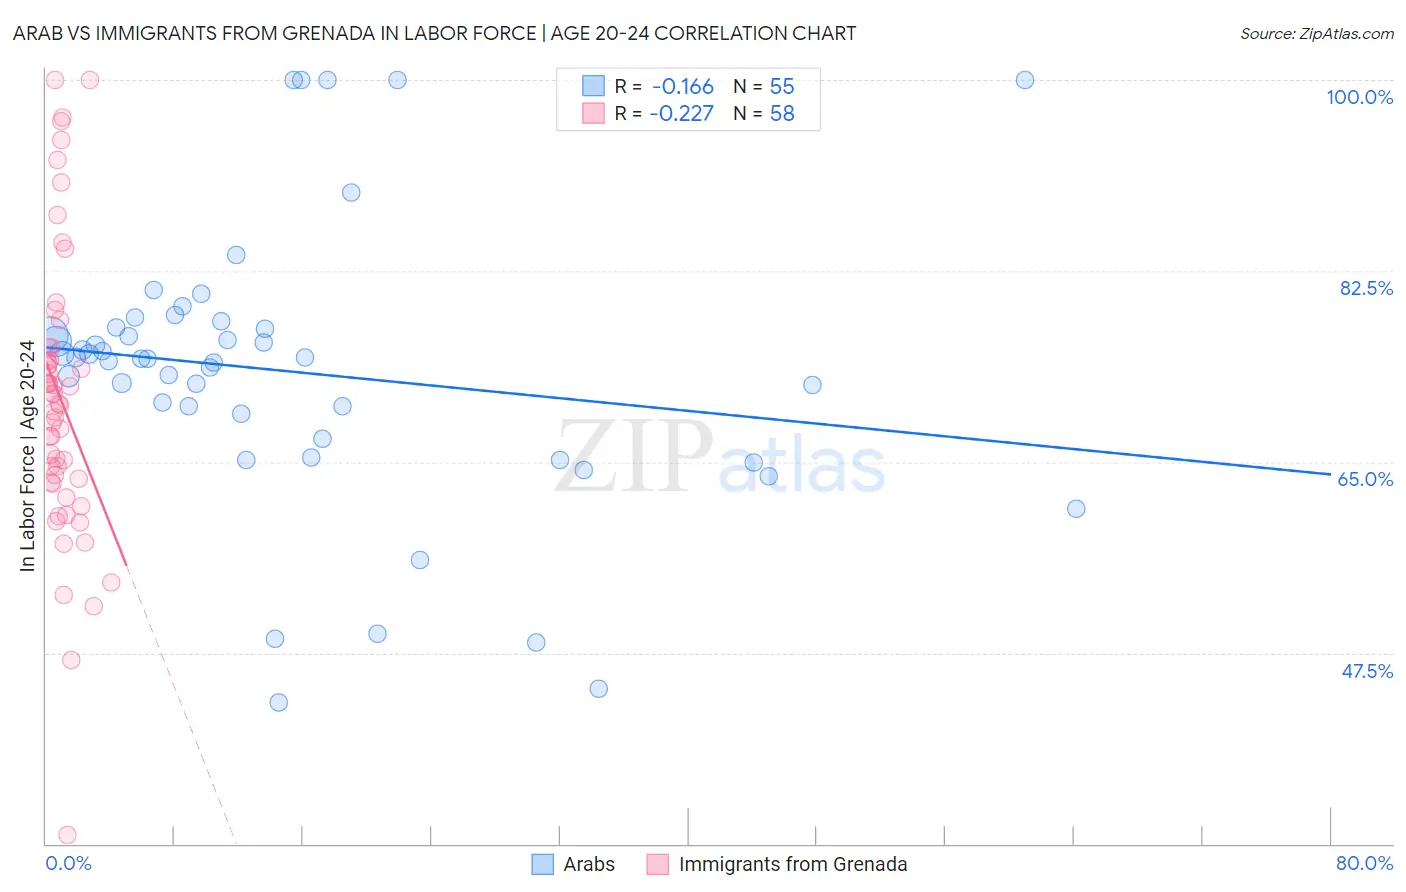
Arab vs Immigrants from Grenada In Labor Force | Age 20-24 Correlation Chart
The statistical analysis conducted on geographies consisting of 486,568,832 people shows a poor negative correlation between the proportion of Arabs and labor force participation rate among population between the ages 20 and 24 in the United States with a correlation coefficient (R) of -0.166 and weighted average of 74.6%. Similarly, the statistical analysis conducted on geographies consisting of 67,199,646 people shows a weak negative correlation between the proportion of Immigrants from Grenada and labor force participation rate among population between the ages 20 and 24 in the United States with a correlation coefficient (R) of -0.227 and weighted average of 67.2%, a difference of 11.1%.
In Labor Force | Age 20-24 Correlation Summary
| Measurement | Arab | Immigrants from Grenada |
| Minimum | 42.9% | 30.8% |
| Maximum | 100.0% | 100.0% |
| Range | 57.1% | 69.2% |
| Mean | 73.2% | 70.7% |
| Median | 74.5% | 70.3% |
| Interquartile 25% (IQ1) | 67.1% | 63.1% |
| Interquartile 75% (IQ3) | 77.3% | 75.5% |
| Interquartile Range (IQR) | 10.2% | 12.4% |
| Standard Deviation (Sample) | 12.8% | 13.3% |
| Standard Deviation (Population) | 12.7% | 13.1% |
Similar Demographics by In Labor Force | Age 20-24
Demographics Similar to Arabs by In Labor Force | Age 20-24
In terms of in labor force | age 20-24, the demographic groups most similar to Arabs are Immigrants from Uruguay (74.6%, a difference of 0.0%), Albanian (74.6%, a difference of 0.010%), Uruguayan (74.6%, a difference of 0.020%), Immigrants from Australia (74.6%, a difference of 0.030%), and Sioux (74.6%, a difference of 0.040%).
| Demographics | Rating | Rank | In Labor Force | Age 20-24 |
| Moroccans | 20.4 /100 | #202 | Fair 74.7% |
| Immigrants | Northern Africa | 17.9 /100 | #203 | Poor 74.6% |
| Immigrants | Italy | 17.6 /100 | #204 | Poor 74.6% |
| Inupiat | 17.6 /100 | #205 | Poor 74.6% |
| Sioux | 17.5 /100 | #206 | Poor 74.6% |
| Albanians | 16.2 /100 | #207 | Poor 74.6% |
| Immigrants | Uruguay | 15.8 /100 | #208 | Poor 74.6% |
| Arabs | 15.8 /100 | #209 | Poor 74.6% |
| Uruguayans | 15.1 /100 | #210 | Poor 74.6% |
| Immigrants | Australia | 14.7 /100 | #211 | Poor 74.6% |
| Creek | 13.3 /100 | #212 | Poor 74.5% |
| Peruvians | 13.3 /100 | #213 | Poor 74.5% |
| Immigrants | Southern Europe | 13.2 /100 | #214 | Poor 74.5% |
| Immigrants | Ghana | 12.7 /100 | #215 | Poor 74.5% |
| Immigrants | Kuwait | 12.7 /100 | #216 | Poor 74.5% |
Demographics Similar to Immigrants from Grenada by In Labor Force | Age 20-24
In terms of in labor force | age 20-24, the demographic groups most similar to Immigrants from Grenada are Puerto Rican (68.3%, a difference of 1.7%), Hopi (66.0%, a difference of 1.7%), Immigrants from St. Vincent and the Grenadines (68.4%, a difference of 1.8%), Tohono O'odham (68.6%, a difference of 2.1%), and Menominee (68.7%, a difference of 2.3%).
| Demographics | Rating | Rank | In Labor Force | Age 20-24 |
| Yuman | 0.0 /100 | #333 | Tragic 70.3% |
| British West Indians | 0.0 /100 | #334 | Tragic 70.0% |
| Immigrants | Barbados | 0.0 /100 | #335 | Tragic 69.7% |
| Immigrants | Guyana | 0.0 /100 | #336 | Tragic 69.3% |
| Guyanese | 0.0 /100 | #337 | Tragic 69.2% |
| Pima | 0.0 /100 | #338 | Tragic 69.0% |
| Immigrants | Yemen | 0.0 /100 | #339 | Tragic 68.9% |
| Menominee | 0.0 /100 | #340 | Tragic 68.7% |
| Tohono O'odham | 0.0 /100 | #341 | Tragic 68.6% |
| Immigrants | St. Vincent and the Grenadines | 0.0 /100 | #342 | Tragic 68.4% |
| Puerto Ricans | 0.0 /100 | #343 | Tragic 68.3% |
| Immigrants | Grenada | 0.0 /100 | #344 | Tragic 67.2% |
| Hopi | 0.0 /100 | #345 | Tragic 66.0% |
| Lumbee | 0.0 /100 | #346 | Tragic 65.5% |
| Navajo | 0.0 /100 | #347 | Tragic 64.8% |