Arab vs Immigrants from Bahamas In Labor Force | Age 16-19

COMPARE

Arab
Race
Ancestry
AfghanAfricanAlaska NativeAlaskan AthabascanAlbanianAleutAlsatianAmericanApacheArabArapahoArgentineanArmenianAssyrian/Chaldean/SyriacAustralianAustrianBahamianBangladeshiBarbadianBasqueBelgianBelizeanBermudanBhutaneseBlackfeetBolivianBrazilianBritishBritish West IndianBulgarianBurmeseCajunCambodianCanadianCape VerdeanCarpatho RusynCelticCentral AmericanCentral American IndianCherokeeCheyenneChickasawChileanChineseChippewaChoctawColombianColvilleComancheCosta RicanCreeCreekCroatianCrowCubanCypriotCzechCzechoslovakianDanishDelawareDominicanDutchDutch West IndianEastern EuropeanEcuadorianEgyptianEnglishEstonianEthiopianEuropeanFijianFilipinoFinnishFrenchFrench American IndianFrench CanadianGermanGerman RussianGhanaianGreekGuamanian/ChamorroGuatemalanGuyaneseHaitianHmongHonduranHopiHoumaHungarianIcelanderIndian (Asian)IndonesianInupiatIranianIraqiIrishIroquoisIsraeliItalianJamaicanJapaneseJordanianKenyanKiowaKoreanLaotianLatvianLebaneseLiberianLithuanianLumbeeLuxembourgerMacedonianMalaysianMalteseMarshalleseMenomineeMexicanMexican American IndianMongolianMoroccanNative HawaiianNavajoNepaleseNew ZealanderNicaraguanNigerianNorthern EuropeanNorwegianOkinawanOsageOttawaPaiutePakistaniPalestinianPanamanianParaguayanPennsylvania GermanPeruvianPimaPolishPortuguesePotawatomiPuebloPuerto RicanPuget Sound SalishRomanianRussianSalvadoranSamoanScandinavianScotch-IrishScottishSeminoleSenegaleseSerbianShoshoneSierra LeoneanSiouxSlavicSlovakSloveneSomaliSouth AfricanSouth AmericanSouth American IndianSoviet UnionSpaniardSpanishSpanish AmericanSpanish American IndianSri LankanSubsaharan AfricanSudaneseSwedishSwissSyrianTaiwaneseThaiTlingit-HaidaTohono O'OdhamTonganTrinidadian and TobagonianTsimshianTurkishU.S. Virgin IslanderUgandanUkrainianUruguayanUteVenezuelanVietnameseWelshWest IndianYakamaYaquiYugoslavianYumanYup'ikZimbabwean
Immigration
NonimmigrantsImmigrantsAfghanistanAfricaAlbaniaArgentinaArmeniaAsiaAustraliaAustriaBangladeshBarbadosBelarusBelgiumBelizeBoliviaBosnia and HerzegovinaBrazilBulgariaBurma/MyanmarCabo VerdeCambodiaCameroonCanadaCaribbeanCentral AmericaChileChinaColombiaCongoCosta RicaCroatiaCubaCzechoslovakiaDenmarkDominicaDominican RepublicEastern AfricaEastern AsiaEastern EuropeEcuadorEgyptEl SalvadorEnglandEritreaEthiopiaEuropeFijiFranceGermanyGhanaGreeceGrenadaGuatemalaGuyanaHaitiHondurasHong KongHungaryIndiaIndonesiaIranIraqIrelandIsraelItalyJamaicaJapanJordanKazakhstanKenyaKoreaKuwaitLaosLatin AmericaLatviaLebanonLiberiaLithuaniaMalaysiaMexicoMicronesiaMiddle AfricaMoldovaMoroccoNepalNetherlandsNicaraguaNigeriaNorth AmericaNorth MacedoniaNorthern AfricaNorthern EuropeNorwayOceaniaPakistanPanamaPeruPhilippinesPolandPortugalRomaniaRussiaSaudi ArabiaScotlandSenegalSerbiaSierra LeoneSingaporeSomaliaSouth AfricaSouth AmericaSouth Central AsiaSouth Eastern AsiaSouthern EuropeSpainSri LankaSt. Vincent and the GrenadinesSudanSwedenSwitzerlandSyriaTaiwanThailandTrinidad and TobagoTurkeyUgandaUkraineUruguayUzbekistanVenezuelaVietnamWest IndiesWestern AfricaWestern AsiaWestern EuropeYemenZaireZimbabweAzores
Immigrants from Bahamas
Race
Ancestry
AfghanAfricanAlaska NativeAlaskan AthabascanAlbanianAleutAlsatianAmericanApacheArapahoArgentineanArmenianAssyrian/Chaldean/SyriacAustralianAustrianBahamianBangladeshiBarbadianBasqueBelgianBelizeanBermudanBhutaneseBlackfeetBolivianBrazilianBritishBritish West IndianBulgarianBurmeseCajunCambodianCanadianCape VerdeanCarpatho RusynCelticCentral AmericanCentral American IndianCherokeeCheyenneChickasawChileanChineseChippewaChoctawColombianColvilleComancheCosta RicanCreeCreekCroatianCrowCubanCypriotCzechCzechoslovakianDanishDelawareDominicanDutchDutch West IndianEastern EuropeanEcuadorianEgyptianEnglishEstonianEthiopianEuropeanFijianFilipinoFinnishFrenchFrench American IndianFrench CanadianGermanGerman RussianGhanaianGreekGuamanian/ChamorroGuatemalanGuyaneseHaitianHmongHonduranHopiHoumaHungarianIcelanderIndian (Asian)IndonesianInupiatIranianIraqiIrishIroquoisIsraeliItalianJamaicanJapaneseJordanianKenyanKiowaKoreanLaotianLatvianLebaneseLiberianLithuanianLumbeeLuxembourgerMacedonianMalaysianMalteseMarshalleseMenomineeMexicanMexican American IndianMongolianMoroccanNative HawaiianNavajoNepaleseNew ZealanderNicaraguanNigerianNorthern EuropeanNorwegianOkinawanOsageOttawaPaiutePakistaniPalestinianPanamanianParaguayanPennsylvania GermanPeruvianPimaPolishPortuguesePotawatomiPuebloPuerto RicanPuget Sound SalishRomanianRussianSalvadoranSamoanScandinavianScotch-IrishScottishSeminoleSenegaleseSerbianShoshoneSierra LeoneanSiouxSlavicSlovakSloveneSomaliSouth AfricanSouth AmericanSouth American IndianSoviet UnionSpaniardSpanishSpanish AmericanSpanish American IndianSri LankanSubsaharan AfricanSudaneseSwedishSwissSyrianTaiwaneseThaiTlingit-HaidaTohono O'OdhamTonganTrinidadian and TobagonianTsimshianTurkishU.S. Virgin IslanderUgandanUkrainianUruguayanUteVenezuelanVietnameseWelshWest IndianYakamaYaquiYugoslavianYumanYup'ikZimbabwean
Immigration
NonimmigrantsImmigrantsAfghanistanAfricaAlbaniaArgentinaArmeniaAsiaAustraliaAustriaBahamasBangladeshBarbadosBelarusBelgiumBelizeBoliviaBosnia and HerzegovinaBrazilBulgariaBurma/MyanmarCabo VerdeCambodiaCameroonCanadaCaribbeanCentral AmericaChileChinaColombiaCongoCosta RicaCroatiaCubaCzechoslovakiaDenmarkDominicaDominican RepublicEastern AfricaEastern AsiaEastern EuropeEcuadorEgyptEl SalvadorEnglandEritreaEthiopiaEuropeFijiFranceGermanyGhanaGreeceGrenadaGuatemalaGuyanaHaitiHondurasHong KongHungaryIndiaIndonesiaIranIraqIrelandIsraelItalyJamaicaJapanJordanKazakhstanKenyaKoreaKuwaitLaosLatin AmericaLatviaLebanonLiberiaLithuaniaMalaysiaMexicoMicronesiaMiddle AfricaMoldovaMoroccoNepalNetherlandsNicaraguaNigeriaNorth AmericaNorth MacedoniaNorthern AfricaNorthern EuropeNorwayOceaniaPakistanPanamaPeruPhilippinesPolandPortugalRomaniaRussiaSaudi ArabiaScotlandSenegalSerbiaSierra LeoneSingaporeSomaliaSouth AfricaSouth AmericaSouth Central AsiaSouth Eastern AsiaSouthern EuropeSpainSri LankaSt. Vincent and the GrenadinesSudanSwedenSwitzerlandSyriaTaiwanThailandTrinidad and TobagoTurkeyUgandaUkraineUruguayUzbekistanVenezuelaVietnamWest IndiesWestern AfricaWestern AsiaWestern EuropeYemenZaireZimbabweAzores
In Labor Force | Age 16-19
Income
Poverty
Unemployment
Labor Participation
Family Structure
Vehicle Availability
Education Level
Disability

In Labor Force | Age 16-19 Comparison

Arabs

Immigrants from Bahamas

Good
Tragic
36.8%
IN LABOR FORCE | AGE 16-19
63.6/ 100
METRIC RATING
167th/ 347
METRIC RANK
35.5%
IN LABOR FORCE | AGE 16-19
8.3/ 100
METRIC RATING
220th/ 347
METRIC RANK

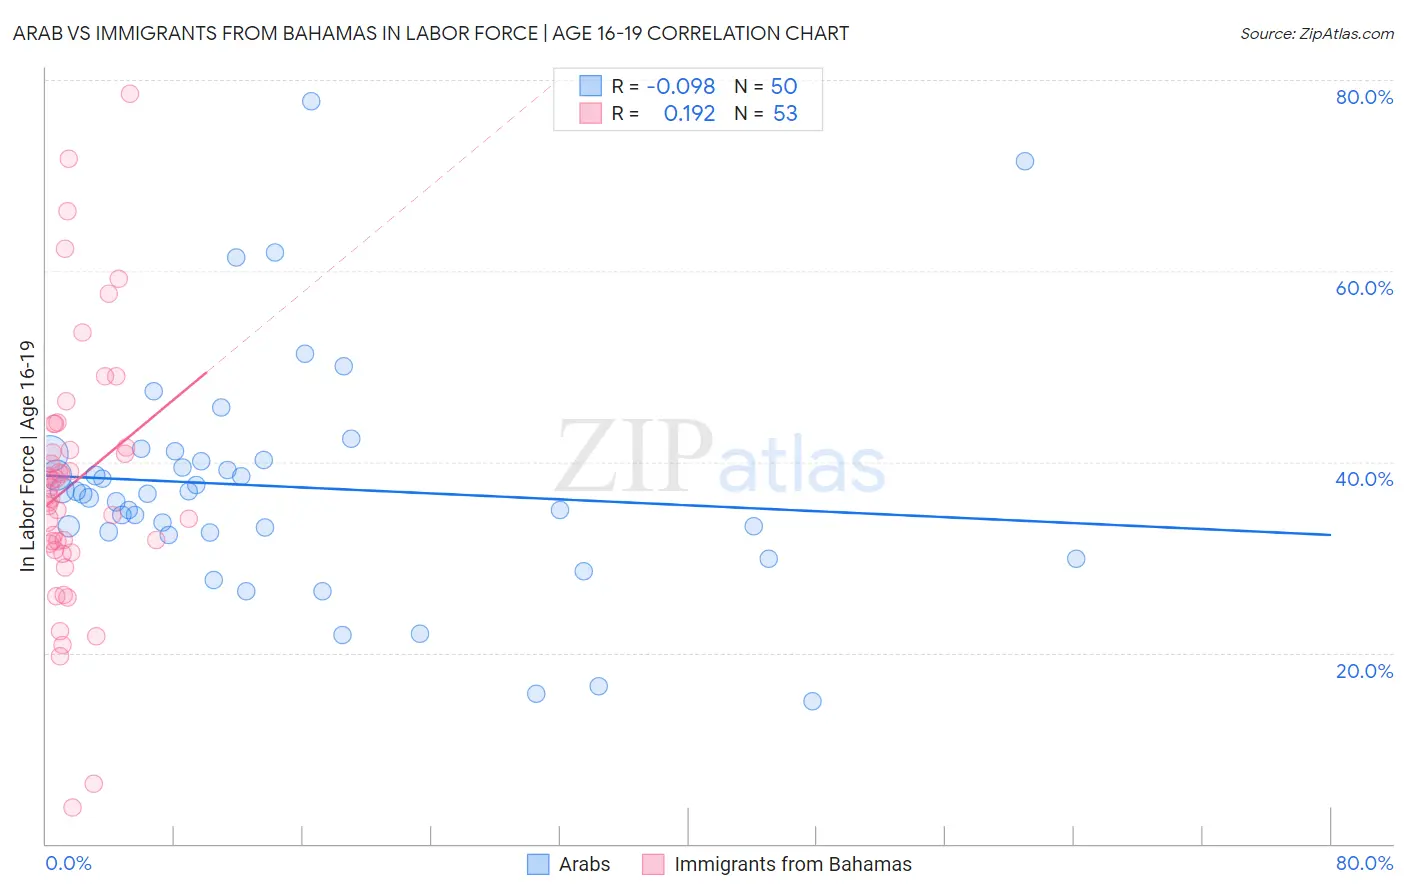
Arab vs Immigrants from Bahamas In Labor Force | Age 16-19 Correlation Chart

The statistical analysis conducted on geographies consisting of 485,752,171 people shows a slight negative correlation between the proportion of Arabs and labor force participation rate among population between the ages 16 and 19 in the United States with a correlation coefficient (R) of -0.098 and weighted average of 36.8%. Similarly, the statistical analysis conducted on geographies consisting of 104,625,160 people shows a poor positive correlation between the proportion of Immigrants from Bahamas and labor force participation rate among population between the ages 16 and 19 in the United States with a correlation coefficient (R) of 0.192 and weighted average of 35.5%, a difference of 3.8%.
Arab vs Immigrants from Bahamas In Labor Force | Age 16-19

In Labor Force | Age 16-19 Correlation Summary

MeasurementArabImmigrants from Bahamas
Minimum14.9%3.8%
Maximum77.8%78.5%
Range62.9%74.7%
Mean37.4%37.8%
Median36.7%36.7%
Interquartile 25% (IQ1)32.6%31.1%
Interquartile 75% (IQ3)40.1%42.7%
Interquartile Range (IQR)7.5%11.6%
Standard Deviation (Sample)12.1%13.9%
Standard Deviation (Population)12.0%13.7%

Similar Demographics by In Labor Force | Age 16-19

Demographics Similar to Arabs by In Labor Force | Age 16-19

In terms of in labor force | age 16-19, the demographic groups most similar to Arabs are Palestinian (36.8%, a difference of 0.030%), Immigrants from Latvia (36.8%, a difference of 0.11%), Immigrants from Western Africa (36.9%, a difference of 0.17%), Immigrants from South Africa (36.8%, a difference of 0.17%), and Yakama (36.9%, a difference of 0.18%).
DemographicsRating | RankIn Labor Force | Age 16-19
Immigrants | Saudi Arabia
73.9
/100
|
#160
Good
37.0%
Cambodians
71.5
/100
|
#161
Good
37.0%
Immigrants | Jordan
69.5
/100
|
#162
Good
36.9%
Bermudans
69.3
/100
|
#163
Good
36.9%
Immigrants | Kuwait
68.9
/100
|
#164
Good
36.9%
Yakama
66.9
/100
|
#165
Good
36.9%
Immigrants | Western Africa
66.7
/100
|
#166
Good
36.9%
Arabs
63.6
/100
|
#167
Good
36.8%
Palestinians
63.1
/100
|
#168
Good
36.8%
Immigrants | Latvia
61.6
/100
|
#169
Good
36.8%
Immigrants | South Africa
60.5
/100
|
#170
Good
36.8%
Immigrants | Cambodia
58.4
/100
|
#171
Average
36.7%
South Africans
58.3
/100
|
#172
Average
36.7%
Russians
57.5
/100
|
#173
Average
36.7%
Immigrants | Czechoslovakia
50.0
/100
|
#174
Average
36.6%

Demographics Similar to Immigrants from Bahamas by In Labor Force | Age 16-19

In terms of in labor force | age 16-19, the demographic groups most similar to Immigrants from Bahamas are Guatemalan (35.5%, a difference of 0.060%), Turkish (35.4%, a difference of 0.18%), Immigrants from Ghana (35.4%, a difference of 0.19%), Sri Lankan (35.5%, a difference of 0.24%), and Ghanaian (35.3%, a difference of 0.33%).
DemographicsRating | RankIn Labor Force | Age 16-19
Immigrants | Bolivia
11.0
/100
|
#213
Poor
35.6%
Apache
11.0
/100
|
#214
Poor
35.6%
Immigrants | South Eastern Asia
10.8
/100
|
#215
Poor
35.6%
Dutch West Indians
10.7
/100
|
#216
Poor
35.6%
Immigrants | Costa Rica
10.7
/100
|
#217
Poor
35.6%
Sri Lankans
9.8
/100
|
#218
Tragic
35.5%
Guatemalans
8.6
/100
|
#219
Tragic
35.5%
Immigrants | Bahamas
8.3
/100
|
#220
Tragic
35.5%
Turks
7.3
/100
|
#221
Tragic
35.4%
Immigrants | Ghana
7.3
/100
|
#222
Tragic
35.4%
Ghanaians
6.5
/100
|
#223
Tragic
35.3%
Hondurans
6.5
/100
|
#224
Tragic
35.3%
Immigrants | Belgium
6.1
/100
|
#225
Tragic
35.3%
Immigrants | Guatemala
5.7
/100
|
#226
Tragic
35.3%
Mongolians
5.7
/100
|
#227
Tragic
35.3%