Apache vs Immigrants from Nepal In Labor Force | Age 16-19
COMPARE
Apache
Immigrants from Nepal
In Labor Force | Age 16-19
In Labor Force | Age 16-19 Comparison
Apache
Immigrants from Nepal
35.6%
IN LABOR FORCE | AGE 16-19
11.0/ 100
METRIC RATING
214th/ 347
METRIC RANK
38.3%
IN LABOR FORCE | AGE 16-19
97.8/ 100
METRIC RATING
118th/ 347
METRIC RANK
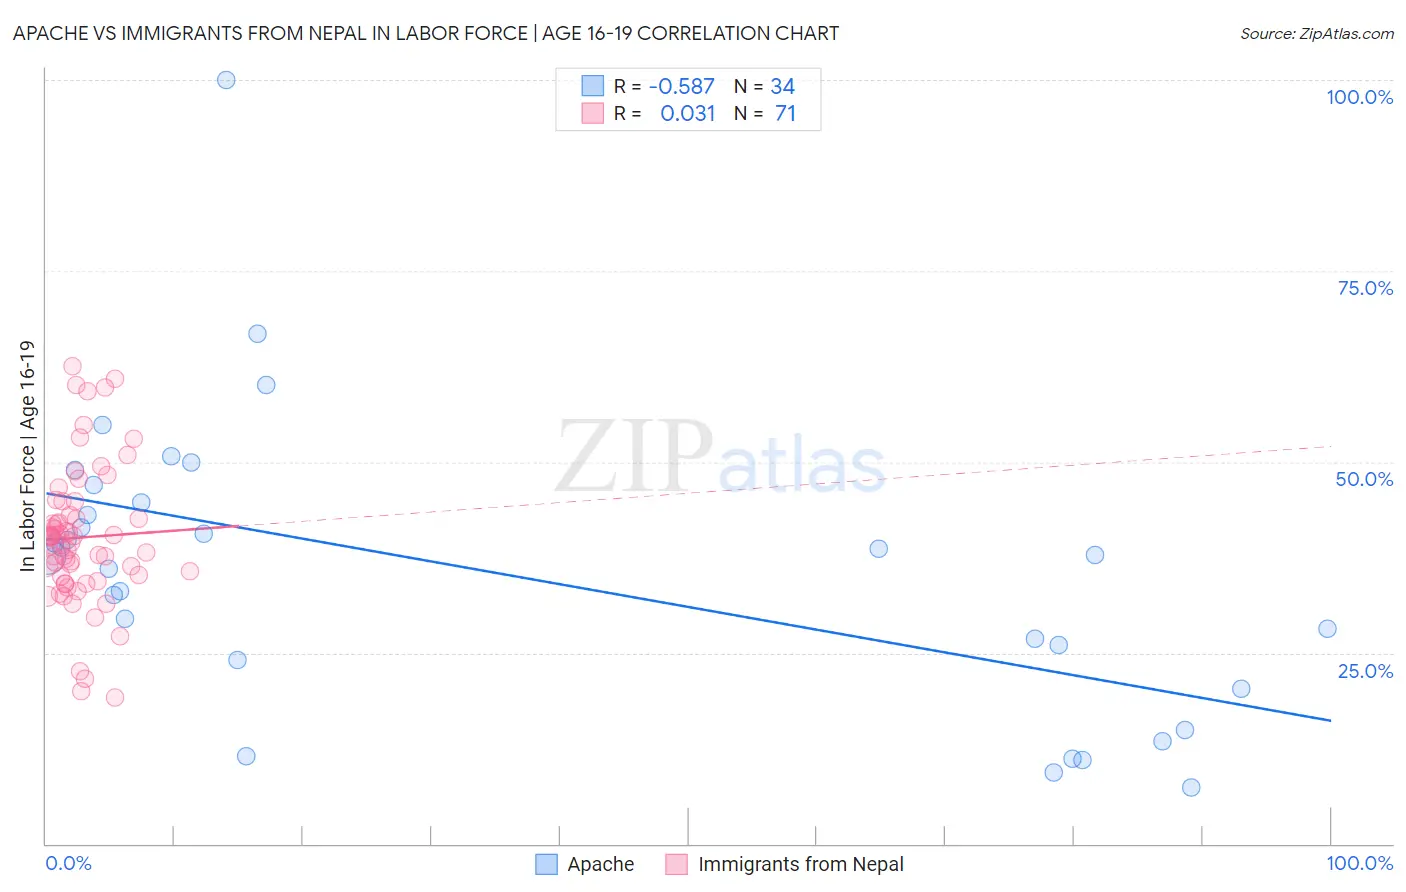
Apache vs Immigrants from Nepal In Labor Force | Age 16-19 Correlation Chart
The statistical analysis conducted on geographies consisting of 230,841,914 people shows a substantial negative correlation between the proportion of Apache and labor force participation rate among population between the ages 16 and 19 in the United States with a correlation coefficient (R) of -0.587 and weighted average of 35.6%. Similarly, the statistical analysis conducted on geographies consisting of 186,763,001 people shows no correlation between the proportion of Immigrants from Nepal and labor force participation rate among population between the ages 16 and 19 in the United States with a correlation coefficient (R) of 0.031 and weighted average of 38.3%, a difference of 7.6%.
In Labor Force | Age 16-19 Correlation Summary
| Measurement | Apache | Immigrants from Nepal |
| Minimum | 7.4% | 19.2% |
| Maximum | 100.0% | 62.5% |
| Range | 92.6% | 43.3% |
| Mean | 35.7% | 40.1% |
| Median | 37.7% | 40.1% |
| Interquartile 25% (IQ1) | 24.0% | 35.0% |
| Interquartile 75% (IQ3) | 44.6% | 43.1% |
| Interquartile Range (IQR) | 20.6% | 8.1% |
| Standard Deviation (Sample) | 19.0% | 9.0% |
| Standard Deviation (Population) | 18.7% | 9.0% |
Similar Demographics by In Labor Force | Age 16-19
Demographics Similar to Apache by In Labor Force | Age 16-19
In terms of in labor force | age 16-19, the demographic groups most similar to Apache are Houma (35.6%, a difference of 0.010%), Immigrants from Bolivia (35.6%, a difference of 0.010%), Immigrants from South Eastern Asia (35.6%, a difference of 0.020%), Dutch West Indian (35.6%, a difference of 0.040%), and Immigrants from Costa Rica (35.6%, a difference of 0.040%).
| Demographics | Rating | Rank | In Labor Force | Age 16-19 |
| Immigrants | Eastern Europe | 14.5 /100 | #207 | Poor 35.8% |
| Koreans | 13.3 /100 | #208 | Poor 35.7% |
| Moroccans | 12.7 /100 | #209 | Poor 35.7% |
| Immigrants | Switzerland | 11.9 /100 | #210 | Poor 35.6% |
| Mexicans | 11.9 /100 | #211 | Poor 35.6% |
| Houma | 11.0 /100 | #212 | Poor 35.6% |
| Immigrants | Bolivia | 11.0 /100 | #213 | Poor 35.6% |
| Apache | 11.0 /100 | #214 | Poor 35.6% |
| Immigrants | South Eastern Asia | 10.8 /100 | #215 | Poor 35.6% |
| Dutch West Indians | 10.7 /100 | #216 | Poor 35.6% |
| Immigrants | Costa Rica | 10.7 /100 | #217 | Poor 35.6% |
| Sri Lankans | 9.8 /100 | #218 | Tragic 35.5% |
| Guatemalans | 8.6 /100 | #219 | Tragic 35.5% |
| Immigrants | Bahamas | 8.3 /100 | #220 | Tragic 35.5% |
| Turks | 7.3 /100 | #221 | Tragic 35.4% |
Demographics Similar to Immigrants from Nepal by In Labor Force | Age 16-19
In terms of in labor force | age 16-19, the demographic groups most similar to Immigrants from Nepal are Chickasaw (38.3%, a difference of 0.010%), Assyrian/Chaldean/Syriac (38.3%, a difference of 0.020%), Colville (38.3%, a difference of 0.060%), Bulgarian (38.3%, a difference of 0.070%), and Ukrainian (38.3%, a difference of 0.10%).
| Demographics | Rating | Rank | In Labor Force | Age 16-19 |
| Crow | 98.5 /100 | #111 | Exceptional 38.5% |
| Immigrants | Scotland | 98.5 /100 | #112 | Exceptional 38.5% |
| Sub-Saharan Africans | 98.3 /100 | #113 | Exceptional 38.4% |
| Hawaiians | 98.2 /100 | #114 | Exceptional 38.4% |
| Bulgarians | 97.9 /100 | #115 | Exceptional 38.3% |
| Colville | 97.9 /100 | #116 | Exceptional 38.3% |
| Chickasaw | 97.8 /100 | #117 | Exceptional 38.3% |
| Immigrants | Nepal | 97.8 /100 | #118 | Exceptional 38.3% |
| Assyrians/Chaldeans/Syriacs | 97.8 /100 | #119 | Exceptional 38.3% |
| Ukrainians | 97.6 /100 | #120 | Exceptional 38.3% |
| Ethiopians | 97.4 /100 | #121 | Exceptional 38.2% |
| Guamanians/Chamorros | 97.4 /100 | #122 | Exceptional 38.2% |
| Seminole | 96.7 /100 | #123 | Exceptional 38.1% |
| Immigrants | England | 96.4 /100 | #124 | Exceptional 38.1% |
| Immigrants | Africa | 96.1 /100 | #125 | Exceptional 38.0% |