American vs Czechoslovakian In Labor Force | Age 45-54
COMPARE
American
Czechoslovakian
In Labor Force | Age 45-54
In Labor Force | Age 45-54 Comparison
Americans
Czechoslovakians
80.4%
IN LABOR FORCE | AGE 45-54
0.0/ 100
METRIC RATING
297th/ 347
METRIC RANK
83.0%
IN LABOR FORCE | AGE 45-54
74.8/ 100
METRIC RATING
147th/ 347
METRIC RANK
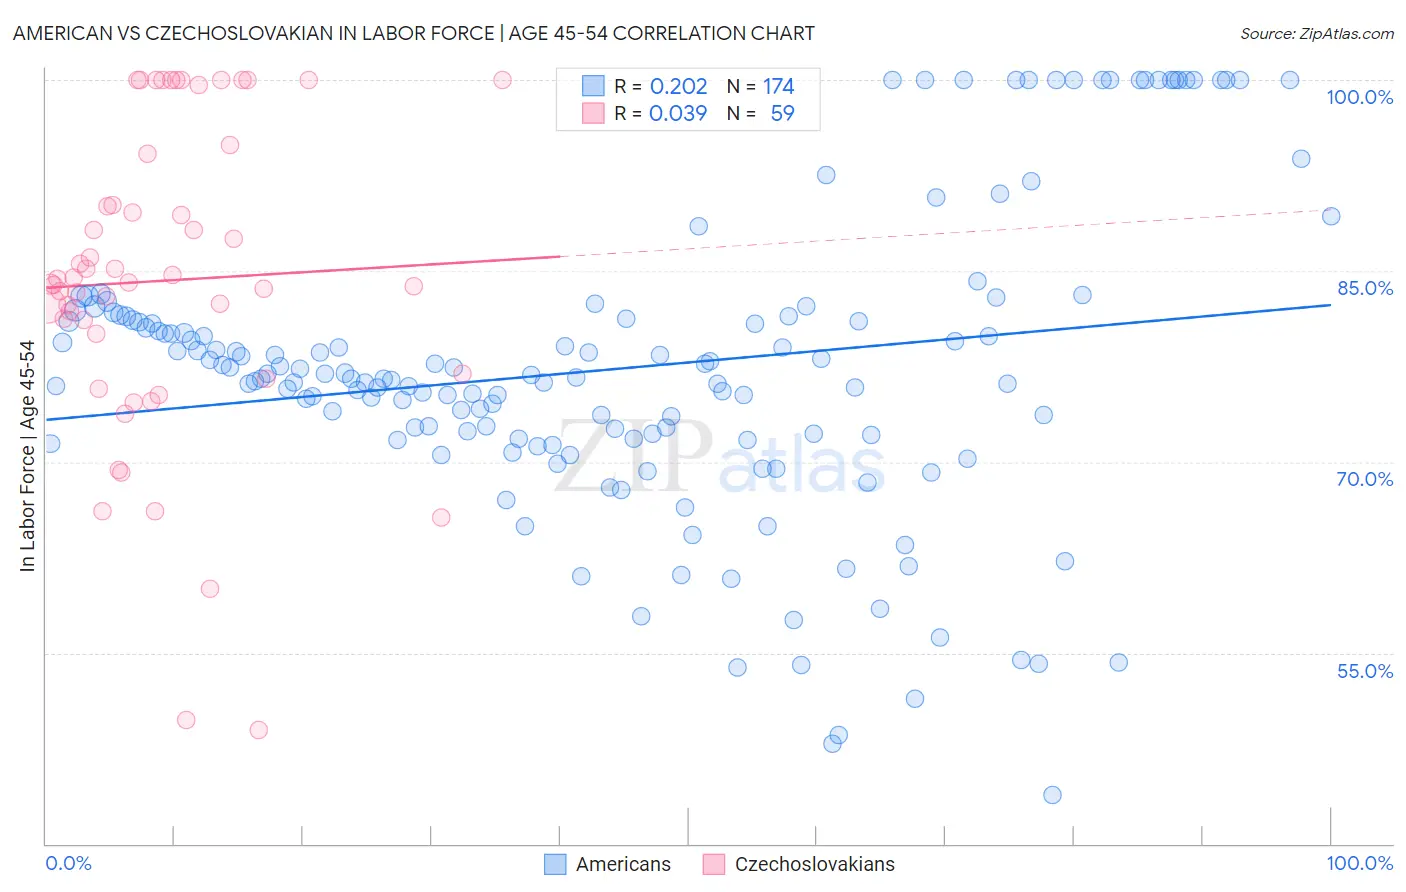
American vs Czechoslovakian In Labor Force | Age 45-54 Correlation Chart
The statistical analysis conducted on geographies consisting of 581,101,031 people shows a weak positive correlation between the proportion of Americans and labor force participation rate among population between the ages 45 and 54 in the United States with a correlation coefficient (R) of 0.202 and weighted average of 80.4%. Similarly, the statistical analysis conducted on geographies consisting of 368,521,801 people shows no correlation between the proportion of Czechoslovakians and labor force participation rate among population between the ages 45 and 54 in the United States with a correlation coefficient (R) of 0.039 and weighted average of 83.0%, a difference of 3.2%.
In Labor Force | Age 45-54 Correlation Summary
| Measurement | American | Czechoslovakian |
| Minimum | 43.8% | 48.9% |
| Maximum | 100.0% | 100.0% |
| Range | 56.2% | 51.1% |
| Mean | 77.3% | 84.2% |
| Median | 76.6% | 84.1% |
| Interquartile 25% (IQ1) | 71.8% | 76.9% |
| Interquartile 75% (IQ3) | 81.3% | 94.2% |
| Interquartile Range (IQR) | 9.5% | 17.3% |
| Standard Deviation (Sample) | 11.8% | 12.2% |
| Standard Deviation (Population) | 11.8% | 12.1% |
Similar Demographics by In Labor Force | Age 45-54
Demographics Similar to Americans by In Labor Force | Age 45-54
In terms of in labor force | age 45-54, the demographic groups most similar to Americans are Marshallese (80.3%, a difference of 0.040%), Dominican (80.3%, a difference of 0.15%), Fijian (80.2%, a difference of 0.15%), Spanish American Indian (80.2%, a difference of 0.17%), and African (80.5%, a difference of 0.18%).
| Demographics | Rating | Rank | In Labor Force | Age 45-54 |
| Mexican American Indians | 0.0 /100 | #290 | Tragic 80.7% |
| Immigrants | Belize | 0.0 /100 | #291 | Tragic 80.6% |
| Iroquois | 0.0 /100 | #292 | Tragic 80.6% |
| Osage | 0.0 /100 | #293 | Tragic 80.6% |
| Yakama | 0.0 /100 | #294 | Tragic 80.6% |
| Nepalese | 0.0 /100 | #295 | Tragic 80.5% |
| Africans | 0.0 /100 | #296 | Tragic 80.5% |
| Americans | 0.0 /100 | #297 | Tragic 80.4% |
| Marshallese | 0.0 /100 | #298 | Tragic 80.3% |
| Dominicans | 0.0 /100 | #299 | Tragic 80.3% |
| Fijians | 0.0 /100 | #300 | Tragic 80.2% |
| Spanish American Indians | 0.0 /100 | #301 | Tragic 80.2% |
| Immigrants | Central America | 0.0 /100 | #302 | Tragic 80.2% |
| Immigrants | Azores | 0.0 /100 | #303 | Tragic 80.1% |
| Hispanics or Latinos | 0.0 /100 | #304 | Tragic 80.1% |
Demographics Similar to Czechoslovakians by In Labor Force | Age 45-54
In terms of in labor force | age 45-54, the demographic groups most similar to Czechoslovakians are Romanian (83.0%, a difference of 0.010%), Immigrants from France (83.0%, a difference of 0.010%), Immigrants from Nigeria (83.0%, a difference of 0.010%), Soviet Union (83.0%, a difference of 0.020%), and Immigrants from Sweden (82.9%, a difference of 0.020%).
| Demographics | Rating | Rank | In Labor Force | Age 45-54 |
| Yugoslavians | 78.3 /100 | #140 | Good 83.0% |
| Immigrants | Haiti | 77.9 /100 | #141 | Good 83.0% |
| Immigrants | Scotland | 77.8 /100 | #142 | Good 83.0% |
| Okinawans | 77.0 /100 | #143 | Good 83.0% |
| Soviet Union | 76.8 /100 | #144 | Good 83.0% |
| Romanians | 75.4 /100 | #145 | Good 83.0% |
| Immigrants | France | 75.3 /100 | #146 | Good 83.0% |
| Czechoslovakians | 74.8 /100 | #147 | Good 83.0% |
| Immigrants | Nigeria | 74.1 /100 | #148 | Good 83.0% |
| Immigrants | Sweden | 73.3 /100 | #149 | Good 82.9% |
| Immigrants | Netherlands | 72.6 /100 | #150 | Good 82.9% |
| Koreans | 71.9 /100 | #151 | Good 82.9% |
| Slavs | 71.5 /100 | #152 | Good 82.9% |
| Immigrants | Indonesia | 70.6 /100 | #153 | Good 82.9% |
| Immigrants | Ghana | 70.3 /100 | #154 | Good 82.9% |