Alaska Native vs Immigrants from Liberia In Labor Force | Age 16-19

COMPARE

Alaska Native
Race
Ancestry
AfghanAfricanAlaska NativeAlaskan AthabascanAlbanianAleutAlsatianAmericanApacheArabArapahoArgentineanArmenianAssyrian/Chaldean/SyriacAustralianAustrianBahamianBangladeshiBarbadianBasqueBelgianBelizeanBermudanBhutaneseBlackfeetBolivianBrazilianBritishBritish West IndianBulgarianBurmeseCajunCambodianCanadianCape VerdeanCarpatho RusynCelticCentral AmericanCentral American IndianCherokeeCheyenneChickasawChileanChineseChippewaChoctawColombianColvilleComancheCosta RicanCreeCreekCroatianCrowCubanCypriotCzechCzechoslovakianDanishDelawareDominicanDutchDutch West IndianEastern EuropeanEcuadorianEgyptianEnglishEstonianEthiopianEuropeanFijianFilipinoFinnishFrenchFrench American IndianFrench CanadianGermanGerman RussianGhanaianGreekGuamanian/ChamorroGuatemalanGuyaneseHaitianHmongHonduranHopiHoumaHungarianIcelanderIndian (Asian)IndonesianInupiatIranianIraqiIrishIroquoisIsraeliItalianJamaicanJapaneseJordanianKenyanKiowaKoreanLaotianLatvianLebaneseLiberianLithuanianLumbeeLuxembourgerMacedonianMalaysianMalteseMarshalleseMenomineeMexicanMexican American IndianMongolianMoroccanNative HawaiianNavajoNepaleseNew ZealanderNicaraguanNigerianNorthern EuropeanNorwegianOkinawanOsageOttawaPaiutePakistaniPalestinianPanamanianParaguayanPennsylvania GermanPeruvianPimaPolishPortuguesePotawatomiPuebloPuerto RicanPuget Sound SalishRomanianRussianSalvadoranSamoanScandinavianScotch-IrishScottishSeminoleSenegaleseSerbianShoshoneSierra LeoneanSiouxSlavicSlovakSloveneSomaliSouth AfricanSouth AmericanSouth American IndianSoviet UnionSpaniardSpanishSpanish AmericanSpanish American IndianSri LankanSubsaharan AfricanSudaneseSwedishSwissSyrianTaiwaneseThaiTlingit-HaidaTohono O'OdhamTonganTrinidadian and TobagonianTsimshianTurkishU.S. Virgin IslanderUgandanUkrainianUruguayanUteVenezuelanVietnameseWelshWest IndianYakamaYaquiYugoslavianYumanYup'ikZimbabwean
Immigration
NonimmigrantsImmigrantsAfghanistanAfricaAlbaniaArgentinaArmeniaAsiaAustraliaAustriaBahamasBangladeshBarbadosBelarusBelgiumBelizeBoliviaBosnia and HerzegovinaBrazilBulgariaBurma/MyanmarCabo VerdeCambodiaCameroonCanadaCaribbeanCentral AmericaChileChinaColombiaCongoCosta RicaCroatiaCubaCzechoslovakiaDenmarkDominicaDominican RepublicEastern AfricaEastern AsiaEastern EuropeEcuadorEgyptEl SalvadorEnglandEritreaEthiopiaEuropeFijiFranceGermanyGhanaGreeceGrenadaGuatemalaGuyanaHaitiHondurasHong KongHungaryIndiaIndonesiaIranIraqIrelandIsraelItalyJamaicaJapanJordanKazakhstanKenyaKoreaKuwaitLaosLatin AmericaLatviaLebanonLithuaniaMalaysiaMexicoMicronesiaMiddle AfricaMoldovaMoroccoNepalNetherlandsNicaraguaNigeriaNorth AmericaNorth MacedoniaNorthern AfricaNorthern EuropeNorwayOceaniaPakistanPanamaPeruPhilippinesPolandPortugalRomaniaRussiaSaudi ArabiaScotlandSenegalSerbiaSierra LeoneSingaporeSomaliaSouth AfricaSouth AmericaSouth Central AsiaSouth Eastern AsiaSouthern EuropeSpainSri LankaSt. Vincent and the GrenadinesSudanSwedenSwitzerlandSyriaTaiwanThailandTrinidad and TobagoTurkeyUgandaUkraineUruguayUzbekistanVenezuelaVietnamWest IndiesWestern AfricaWestern AsiaWestern EuropeYemenZaireZimbabweAzores
Immigrants from Liberia
Race
Ancestry
AfghanAfricanAlaskan AthabascanAlbanianAleutAlsatianAmericanApacheArabArapahoArgentineanArmenianAssyrian/Chaldean/SyriacAustralianAustrianBahamianBangladeshiBarbadianBasqueBelgianBelizeanBermudanBhutaneseBlackfeetBolivianBrazilianBritishBritish West IndianBulgarianBurmeseCajunCambodianCanadianCape VerdeanCarpatho RusynCelticCentral AmericanCentral American IndianCherokeeCheyenneChickasawChileanChineseChippewaChoctawColombianColvilleComancheCosta RicanCreeCreekCroatianCrowCubanCypriotCzechCzechoslovakianDanishDelawareDominicanDutchDutch West IndianEastern EuropeanEcuadorianEgyptianEnglishEstonianEthiopianEuropeanFijianFilipinoFinnishFrenchFrench American IndianFrench CanadianGermanGerman RussianGhanaianGreekGuamanian/ChamorroGuatemalanGuyaneseHaitianHmongHonduranHopiHoumaHungarianIcelanderIndian (Asian)IndonesianInupiatIranianIraqiIrishIroquoisIsraeliItalianJamaicanJapaneseJordanianKenyanKiowaKoreanLaotianLatvianLebaneseLiberianLithuanianLumbeeLuxembourgerMacedonianMalaysianMalteseMarshalleseMenomineeMexicanMexican American IndianMongolianMoroccanNative HawaiianNavajoNepaleseNew ZealanderNicaraguanNigerianNorthern EuropeanNorwegianOkinawanOsageOttawaPaiutePakistaniPalestinianPanamanianParaguayanPennsylvania GermanPeruvianPimaPolishPortuguesePotawatomiPuebloPuerto RicanPuget Sound SalishRomanianRussianSalvadoranSamoanScandinavianScotch-IrishScottishSeminoleSenegaleseSerbianShoshoneSierra LeoneanSiouxSlavicSlovakSloveneSomaliSouth AfricanSouth AmericanSouth American IndianSoviet UnionSpaniardSpanishSpanish AmericanSpanish American IndianSri LankanSubsaharan AfricanSudaneseSwedishSwissSyrianTaiwaneseThaiTlingit-HaidaTohono O'OdhamTonganTrinidadian and TobagonianTsimshianTurkishU.S. Virgin IslanderUgandanUkrainianUruguayanUteVenezuelanVietnameseWelshWest IndianYakamaYaquiYugoslavianYumanYup'ikZimbabwean
Immigration
NonimmigrantsImmigrantsAfghanistanAfricaAlbaniaArgentinaArmeniaAsiaAustraliaAustriaBahamasBangladeshBarbadosBelarusBelgiumBelizeBoliviaBosnia and HerzegovinaBrazilBulgariaBurma/MyanmarCabo VerdeCambodiaCameroonCanadaCaribbeanCentral AmericaChileChinaColombiaCongoCosta RicaCroatiaCubaCzechoslovakiaDenmarkDominicaDominican RepublicEastern AfricaEastern AsiaEastern EuropeEcuadorEgyptEl SalvadorEnglandEritreaEthiopiaEuropeFijiFranceGermanyGhanaGreeceGrenadaGuatemalaGuyanaHaitiHondurasHong KongHungaryIndiaIndonesiaIranIraqIrelandIsraelItalyJamaicaJapanJordanKazakhstanKenyaKoreaKuwaitLaosLatin AmericaLatviaLebanonLiberiaLithuaniaMalaysiaMexicoMicronesiaMiddle AfricaMoldovaMoroccoNepalNetherlandsNicaraguaNigeriaNorth AmericaNorth MacedoniaNorthern AfricaNorthern EuropeNorwayOceaniaPakistanPanamaPeruPhilippinesPolandPortugalRomaniaRussiaSaudi ArabiaScotlandSenegalSerbiaSierra LeoneSingaporeSomaliaSouth AfricaSouth AmericaSouth Central AsiaSouth Eastern AsiaSouthern EuropeSpainSri LankaSt. Vincent and the GrenadinesSudanSwedenSwitzerlandSyriaTaiwanThailandTrinidad and TobagoTurkeyUgandaUkraineUruguayUzbekistanVenezuelaVietnamWest IndiesWestern AfricaWestern AsiaWestern EuropeYemenZaireZimbabweAzores
In Labor Force | Age 16-19
Income
Poverty
Unemployment
Labor Participation
Family Structure
Vehicle Availability
Education Level
Disability

In Labor Force | Age 16-19 Comparison

Alaska Natives

Immigrants from Liberia

Exceptional
Exceptional
39.1%
IN LABOR FORCE | AGE 16-19
99.6/ 100
METRIC RATING
89th/ 347
METRIC RANK
41.5%
IN LABOR FORCE | AGE 16-19
100.0/ 100
METRIC RATING
40th/ 347
METRIC RANK

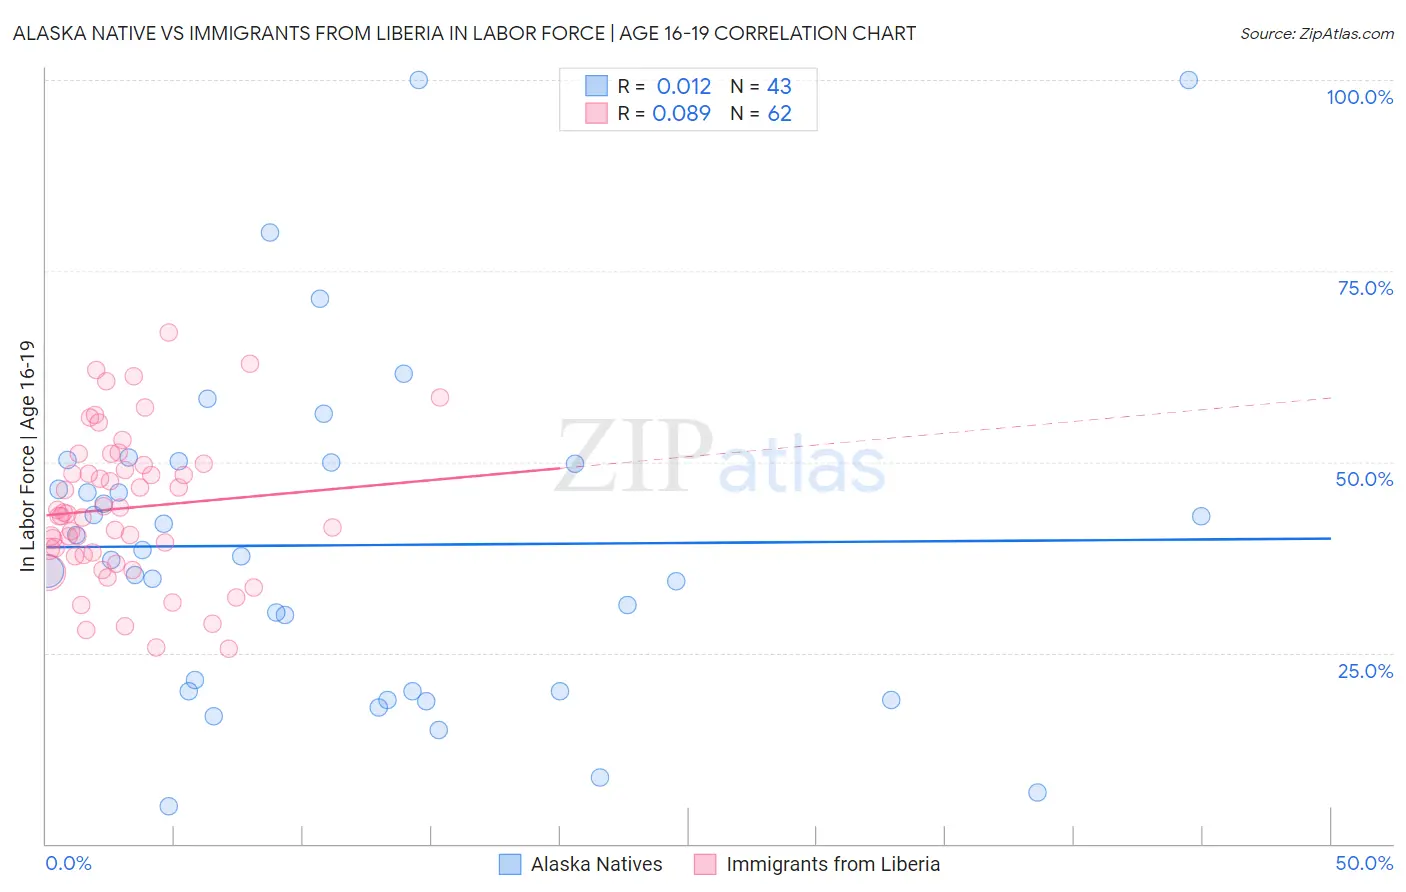
Alaska Native vs Immigrants from Liberia In Labor Force | Age 16-19 Correlation Chart

The statistical analysis conducted on geographies consisting of 76,723,647 people shows no correlation between the proportion of Alaska Natives and labor force participation rate among population between the ages 16 and 19 in the United States with a correlation coefficient (R) of 0.012 and weighted average of 39.1%. Similarly, the statistical analysis conducted on geographies consisting of 135,255,141 people shows a slight positive correlation between the proportion of Immigrants from Liberia and labor force participation rate among population between the ages 16 and 19 in the United States with a correlation coefficient (R) of 0.089 and weighted average of 41.5%, a difference of 6.1%.
Alaska Native vs Immigrants from Liberia In Labor Force | Age 16-19

In Labor Force | Age 16-19 Correlation Summary

MeasurementAlaska NativeImmigrants from Liberia
Minimum4.9%25.5%
Maximum100.0%66.9%
Range95.1%41.4%
Mean39.1%43.9%
Median37.6%43.0%
Interquartile 25% (IQ1)20.0%37.8%
Interquartile 75% (IQ3)50.0%49.6%
Interquartile Range (IQR)30.0%11.8%
Standard Deviation (Sample)21.7%9.6%
Standard Deviation (Population)21.4%9.5%

Similar Demographics by In Labor Force | Age 16-19

Demographics Similar to Alaska Natives by In Labor Force | Age 16-19

In terms of in labor force | age 16-19, the demographic groups most similar to Alaska Natives are Puget Sound Salish (39.1%, a difference of 0.010%), Immigrants from Germany (39.1%, a difference of 0.080%), Immigrants from Burma/Myanmar (39.0%, a difference of 0.080%), Samoan (39.1%, a difference of 0.16%), and Creek (39.1%, a difference of 0.18%).
DemographicsRating | RankIn Labor Force | Age 16-19
Basques
99.7
/100
|
#82
Exceptional
39.3%
Spanish
99.7
/100
|
#83
Exceptional
39.3%
Immigrants | Uganda
99.7
/100
|
#84
Exceptional
39.2%
Creek
99.6
/100
|
#85
Exceptional
39.1%
Samoans
99.6
/100
|
#86
Exceptional
39.1%
Immigrants | Germany
99.6
/100
|
#87
Exceptional
39.1%
Puget Sound Salish
99.6
/100
|
#88
Exceptional
39.1%
Alaska Natives
99.6
/100
|
#89
Exceptional
39.1%
Immigrants | Burma/Myanmar
99.5
/100
|
#90
Exceptional
39.0%
Spanish Americans
99.5
/100
|
#91
Exceptional
39.0%
Osage
99.4
/100
|
#92
Exceptional
39.0%
Blackfeet
99.4
/100
|
#93
Exceptional
38.9%
Immigrants | Canada
99.4
/100
|
#94
Exceptional
38.9%
Immigrants | North America
99.4
/100
|
#95
Exceptional
38.9%
Latvians
99.4
/100
|
#96
Exceptional
38.9%

Demographics Similar to Immigrants from Liberia by In Labor Force | Age 16-19

In terms of in labor force | age 16-19, the demographic groups most similar to Immigrants from Liberia are Scotch-Irish (41.5%, a difference of 0.10%), Sioux (41.5%, a difference of 0.23%), Celtic (41.3%, a difference of 0.34%), White/Caucasian (41.3%, a difference of 0.35%), and Immigrants from Congo (41.7%, a difference of 0.58%).
DemographicsRating | RankIn Labor Force | Age 16-19
Liberians
100.0
/100
|
#33
Exceptional
41.8%
Immigrants | Bosnia and Herzegovina
100.0
/100
|
#34
Exceptional
41.8%
Yugoslavians
100.0
/100
|
#35
Exceptional
41.8%
Immigrants | Azores
100.0
/100
|
#36
Exceptional
41.7%
Immigrants | Congo
100.0
/100
|
#37
Exceptional
41.7%
Sioux
100.0
/100
|
#38
Exceptional
41.5%
Scotch-Irish
100.0
/100
|
#39
Exceptional
41.5%
Immigrants | Liberia
100.0
/100
|
#40
Exceptional
41.5%
Celtics
100.0
/100
|
#41
Exceptional
41.3%
Whites/Caucasians
100.0
/100
|
#42
Exceptional
41.3%
Tongans
100.0
/100
|
#43
Exceptional
41.2%
Europeans
100.0
/100
|
#44
Exceptional
41.1%
Croatians
100.0
/100
|
#45
Exceptional
41.1%
Immigrants | Sudan
100.0
/100
|
#46
Exceptional
41.0%
Carpatho Rusyns
100.0
/100
|
#47
Exceptional
40.8%