Zip Codes with the Highest Percentage of Population Employed in Security & Protection in Hammond, LA
RELATED REPORTS & OPTIONS
Security & Protection
Hammond
Compare Zip Codes
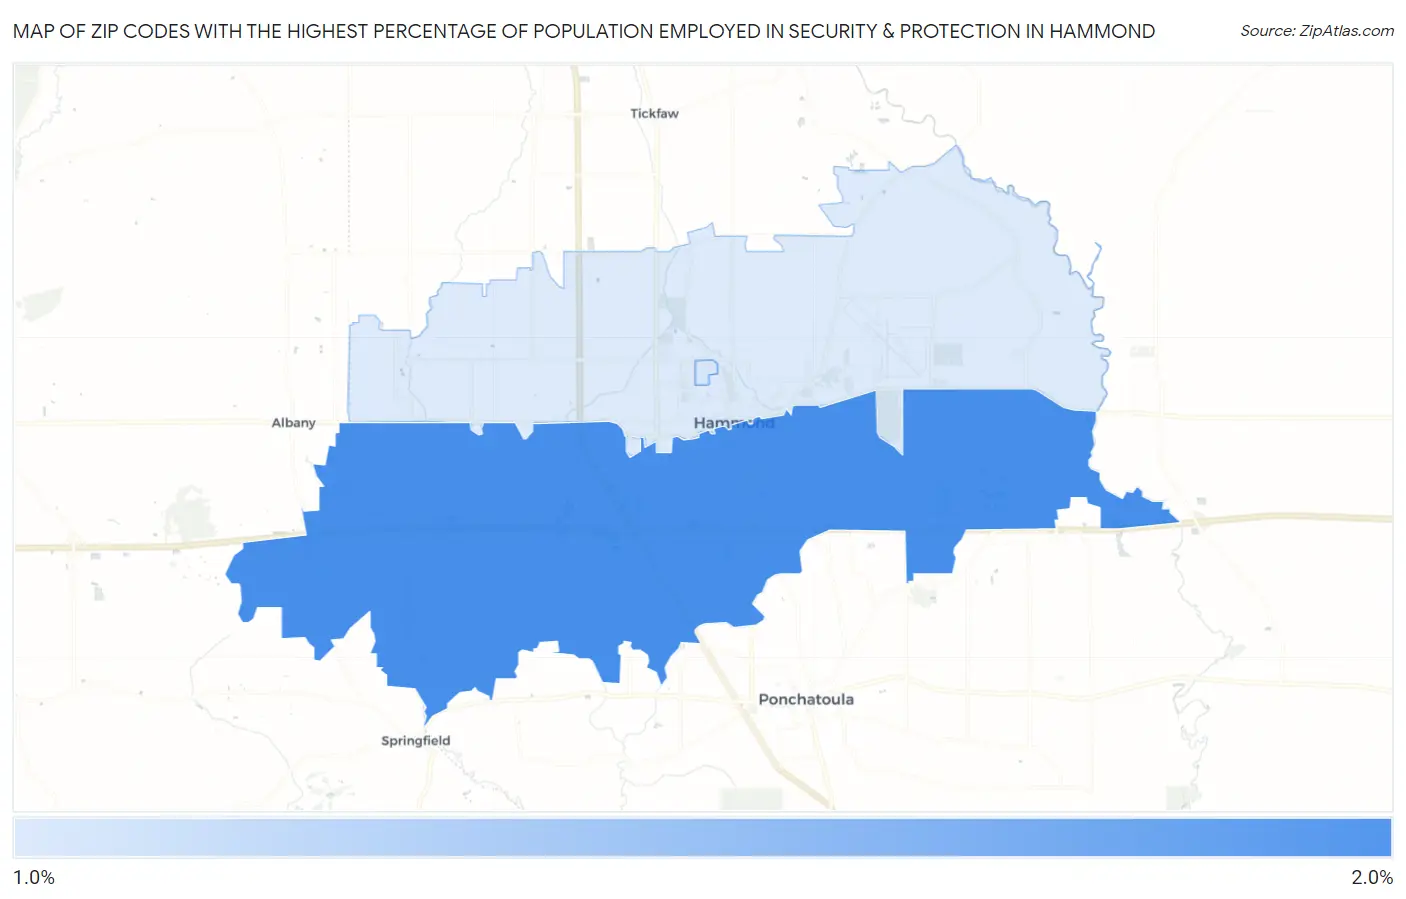
Map of Zip Codes with the Highest Percentage of Population Employed in Security & Protection in Hammond
0.0%
2.0%
Zip Codes with the Highest Percentage of Population Employed in Security & Protection in Hammond, LA
| Zip Code | % Employed | vs State | vs National | |
| 1. | 70403 | 1.8% | 2.6%(-0.786)#295 | 2.1%(-0.327)#13,773 |
| 2. | 70402 | 1.1% | 2.6%(-1.47)#347 | 2.1%(-1.01)#18,975 |
| 3. | 70401 | 1.1% | 2.6%(-1.50)#351 | 2.1%(-1.04)#19,242 |
1
Common Questions
What are the Top Zip Codes with the Highest Percentage of Population Employed in Security & Protection in Hammond, LA?
Top Zip Codes with the Highest Percentage of Population Employed in Security & Protection in Hammond, LA are:
What zip code has the Highest Percentage of Population Employed in Security & Protection in Hammond, LA?
70403 has the Highest Percentage of Population Employed in Security & Protection in Hammond, LA with 1.8%.
What is the Percentage of Population Employed in Security & Protection in Hammond, LA?
Percentage of Population Employed in Security & Protection in Hammond is 1.7%.
What is the Percentage of Population Employed in Security & Protection in Louisiana?
Percentage of Population Employed in Security & Protection in Louisiana is 2.6%.
What is the Percentage of Population Employed in Security & Protection in the United States?
Percentage of Population Employed in Security & Protection in the United States is 2.1%.