Zip Codes with the Highest Percentage of Population Employed in Transportation & Warehousing in Gretna, LA
RELATED REPORTS & OPTIONS
Transportation & Warehousing
Gretna
Compare Zip Codes
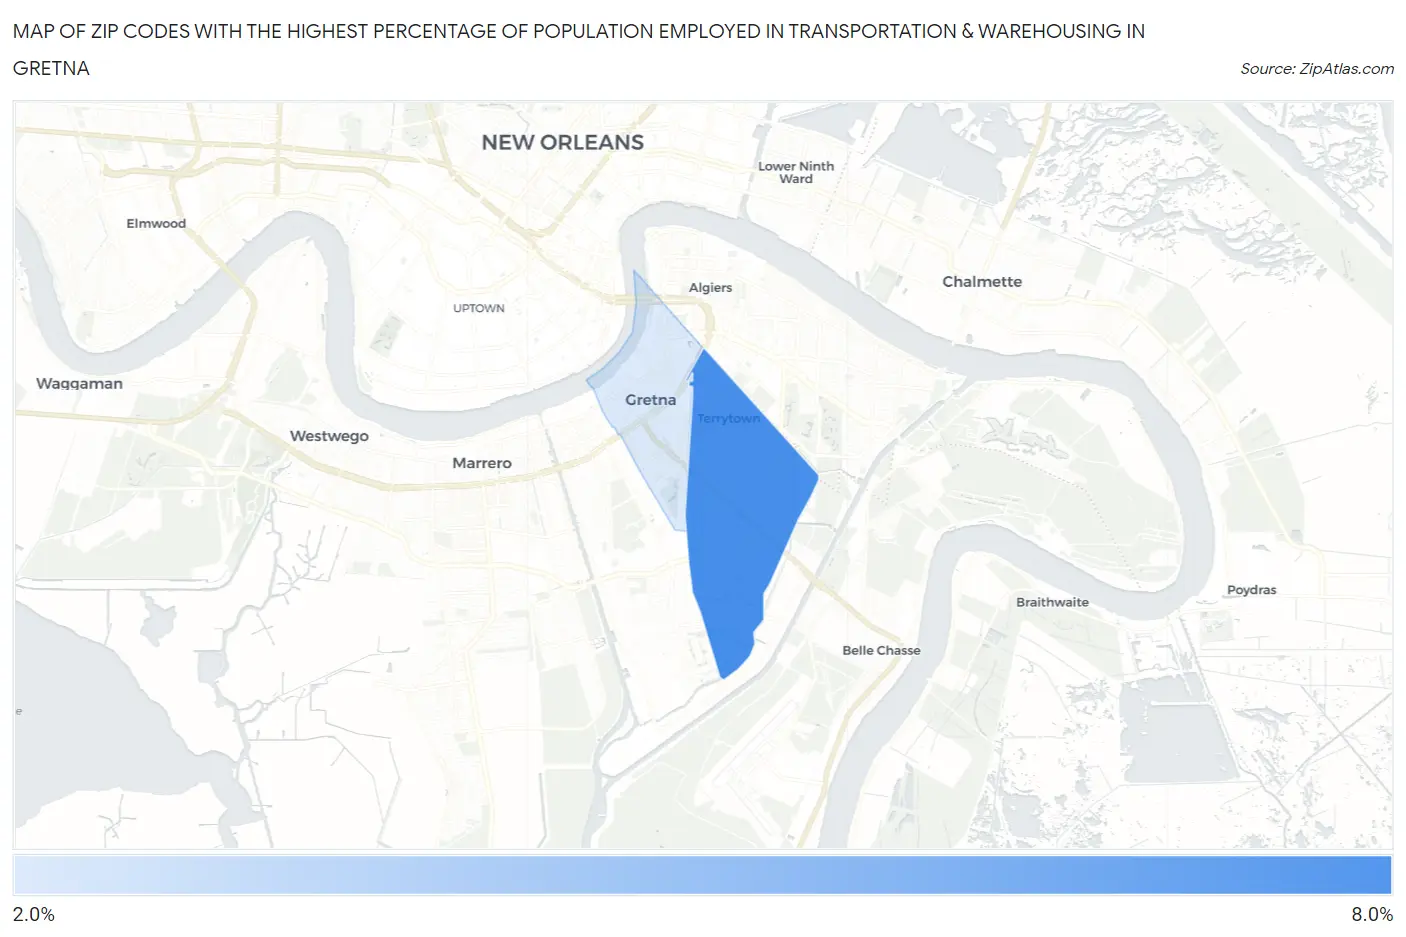
Map of Zip Codes with the Highest Percentage of Population Employed in Transportation & Warehousing in Gretna
0.0%
8.0%
Zip Codes with the Highest Percentage of Population Employed in Transportation & Warehousing in Gretna, LA
| Zip Code | % Employed | vs State | vs National | |
| 1. | 70056 | 7.8% | 4.6%(+3.21)#74 | 4.9%(+2.90)#5,112 |
| 2. | 70053 | 2.5% | 4.6%(-2.16)#338 | 4.9%(-2.47)#22,488 |
1
Common Questions
What are the Top Zip Codes with the Highest Percentage of Population Employed in Transportation & Warehousing in Gretna, LA?
Top Zip Codes with the Highest Percentage of Population Employed in Transportation & Warehousing in Gretna, LA are:
What zip code has the Highest Percentage of Population Employed in Transportation & Warehousing in Gretna, LA?
70056 has the Highest Percentage of Population Employed in Transportation & Warehousing in Gretna, LA with 7.8%.
What is the Percentage of Population Employed in Transportation & Warehousing in Gretna, LA?
Percentage of Population Employed in Transportation & Warehousing in Gretna is 2.5%.
What is the Percentage of Population Employed in Transportation & Warehousing in Louisiana?
Percentage of Population Employed in Transportation & Warehousing in Louisiana is 4.6%.
What is the Percentage of Population Employed in Transportation & Warehousing in the United States?
Percentage of Population Employed in Transportation & Warehousing in the United States is 4.9%.